OPEN-SOURCE SCRIPT
DayHigh - Plot the Moving Average of the Daily High
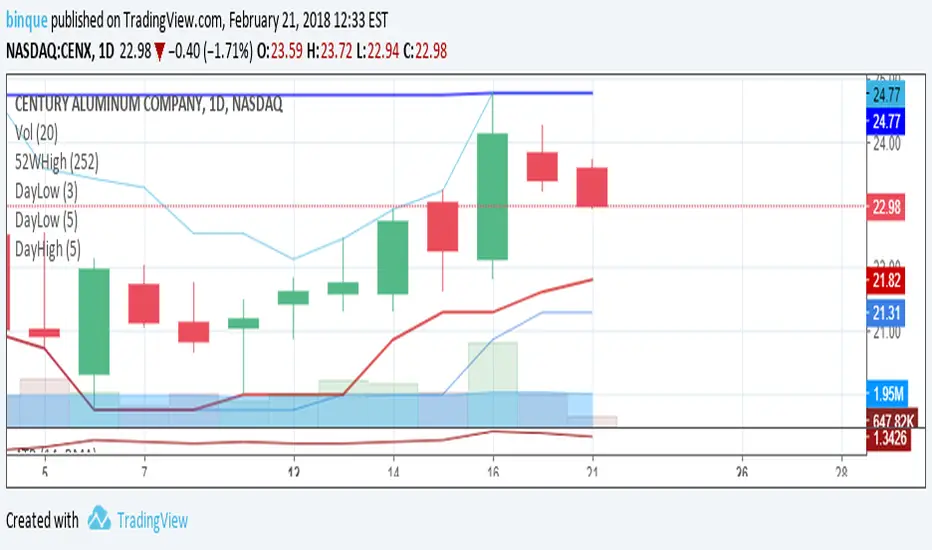
Plot the Moving Average of the Daily High for short periods of time (i.e 3 day or 5 day). Great for detecting when a stocks SELL pressure is running out and time to switch to a BUY strategy. Use in the DayHIGH indicator for nice price channels on a chart.
Open-source script
In true TradingView spirit, the creator of this script has made it open-source, so that traders can review and verify its functionality. Kudos to the author! While you can use it for free, remember that republishing the code is subject to our House Rules.
Disclaimer
The information and publications are not meant to be, and do not constitute, financial, investment, trading, or other types of advice or recommendations supplied or endorsed by TradingView. Read more in the Terms of Use.