OPEN-SOURCE SCRIPT
RSI (Pr)
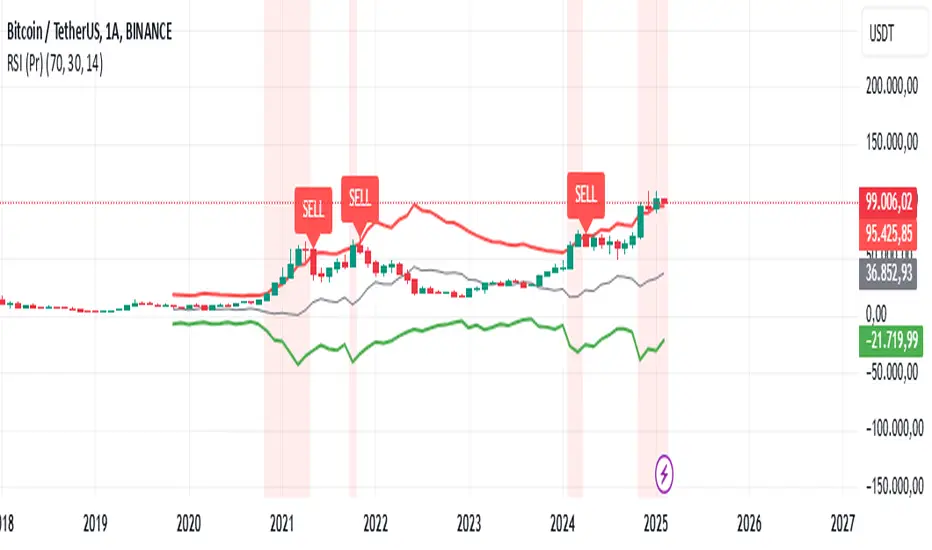
The "RSI (Pr)" indicator enhances the traditional Relative Strength Index (RSI) by incorporating dynamic bands and highlighting extreme market conditions directly on the price chart. This approach offers traders a more intuitive visualization of potential overbought and oversold zones, facilitating timely decision-making.
Key Features:
Dynamic RSI Bands: The indicator calculates upper and lower bands based on user-defined overbought and oversold levels. These bands adjust in real-time, providing a responsive measure of market extremes.
Visual Alerts: Background colors change when the price moves outside the RSI bands, offering immediate visual cues of potential market reversals.
Buy/Sell Signals: The script places "BUY" and "SELL" labels on the chart when the price crosses above or below the RSI bands, assisting traders in identifying potential entry and exit points.
How It Works:
RSI Calculation: The script computes the RSI based on the closing price and a user-defined length (default is 14 periods).
Exponential Moving Averages (EMA): It calculates the EMA of the maximum gains and losses to smooth out the data, enhancing the reliability of the RSI bands.
Upper and Lower Bands: Using the smoothed data, the script determines the upper (resistance) and lower (support) bands, which represent dynamic overbought and oversold levels.
Visual Indicators: The script plots the upper and lower bands, as well as a midline, directly on the price chart. Background colors change when the price exceeds these bands, and "BUY" or "SELL" labels appear at crossover points.
Usage:
Overbought Conditions: When the price crosses above the upper band, it may indicate an overbought condition, suggesting a potential selling opportunity.
Oversold Conditions: When the price crosses below the lower band, it may indicate an oversold condition, suggesting a potential buying opportunity.
Customization:
Users can adjust the following parameters to suit their trading preferences:
RSI Overbought Level: Default is 70.
RSI Oversold Level: Default is 30.
RSI Length: Default is 14 periods.
Disclaimer:
This indicator is designed for educational purposes and should not be construed as financial advice. Trading involves significant risk, and it's essential to conduct thorough research and consider your financial situation before making trading decisions. Past performance is not indicative of future results.
By integrating dynamic RSI bands and clear visual signals directly onto the price chart, this indicator aims to provide traders with actionable insights into market conditions, enhancing the traditional RSI analysis.
Open-source script
In true TradingView spirit, the creator of this script has made it open-source, so that traders can review and verify its functionality. Kudos to the author! While you can use it for free, remember that republishing the code is subject to our House Rules.
Disclaimer
The information and publications are not meant to be, and do not constitute, financial, investment, trading, or other types of advice or recommendations supplied or endorsed by TradingView. Read more in the Terms of Use.