PROTECTED SOURCE SCRIPT
Dynamic Pivot Point
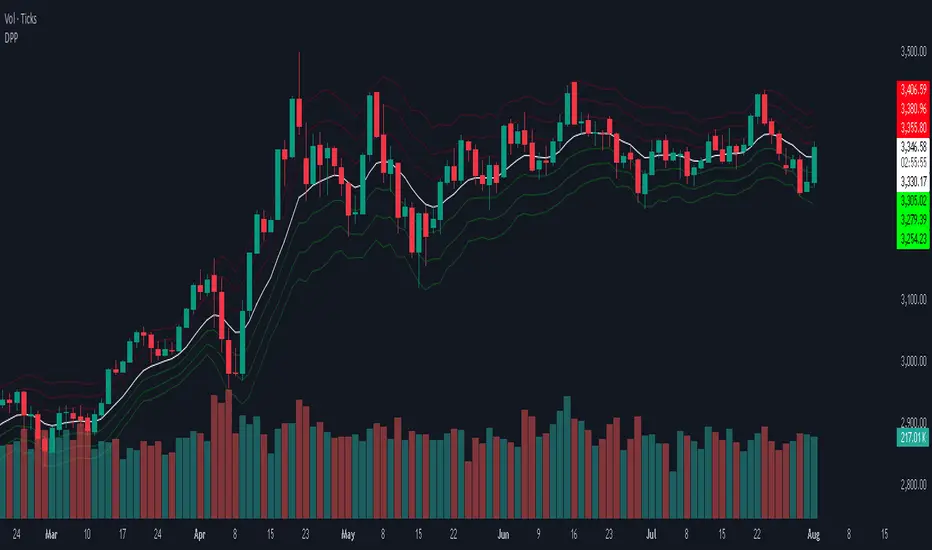
This indicator calculates and displays dynamic pivot points (Pivot, Support, and Resistance levels) based on a selected timeframe. These levels help traders identify potential price reversal zones, support/resistance, and trend direction.
it calculates:
Support Levels (S1, S2, S3)
Resistance Levels (R1, R2, R3)
Dynamic Feature:
a pivot defined period ( default = 5). you can change .
You can choose a specific timeframe (pivotTimeFrame) for calculating pivot levels (e.g., Daily, Weekly, etc.).
Visibility Toggle:
You can turn the pivot levels on or off using the input toggle.
Color Scheme:
Pivot Line: White
Support Levels: Green (S1, S2, S3)
Resistance Levels: Red (R1, R2, R3)
How to Trade With It:
1. Support and Resistance Reversals:
Buy near support levels (S1, S2, S3) if price shows bullish reversal signals.
Sell near resistance levels (R1, R2, R3) if price shows bearish reversal signals.
2. Breakout Trading:
Break above R1/R2/R3 with strong volume may indicate a bullish breakout — consider long positions.
Break below S1/S2/S3 may signal a bearish breakout — consider short positions.
3. Trend Confirmation:
If price stays above Pivot and supports hold — trend is likely bullish.
If price stays below Pivot and resistances hold — trend is likely bearish.
Protected script
This script is published as closed-source. However, you can use it freely and without any limitations – learn more here.
Disclaimer
The information and publications are not meant to be, and do not constitute, financial, investment, trading, or other types of advice or recommendations supplied or endorsed by TradingView. Read more in the Terms of Use.