PROTECTED SOURCE SCRIPT
DM Scalp 70% Confluence
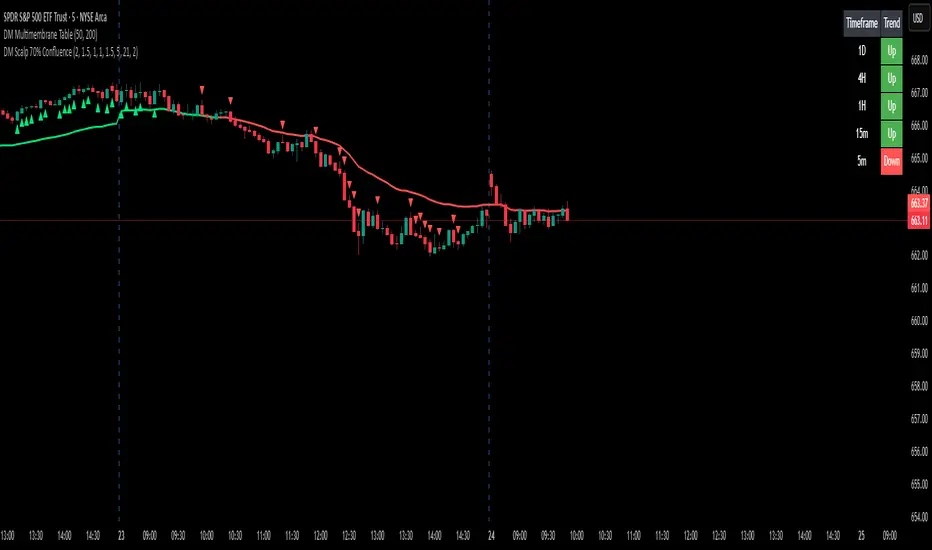
DM Scalp 70% Confluence indicator is a signal generator, not an automated strategy. That means it plots visual cues (triangles) to tell you when conditions are favorable for a scalp trade, but you have to enter the trade manually.
Let’s break it down step by step
1. Understand What the Indicator Does
When multiple bullish or bearish technical conditions agree.
Each signal checks 8 factors (EMA alignment, RSI, VWAP, volume, momentum, etc.).
If 70% (≥ 5.6/8) agree:
Green triangle (CALL) → bullish scalp signal
Red triangle (PUT) → bearish scalp signal
It’s optimized for SPY on 1-minute and 5-minute timeframes — short-term scalping setups.
2. Entry for Long (CALL) Trades
When you see a green triangle (triangle up) under a candle:
Confirm the setup:
The composite line (EMA+VWAP) is turning up and colored green.
Price is above the composite line or crossing above it.
RSI > 55 and increasing.
Volume is at or above its 20-bar average.
Entry timing:
Enter on the candle close of the signal bar.
Conservative traders may wait for the next candle to confirm continuation (e.g., higher close).
Stop-loss:
Place just below the composite line or below the last swing low.
For 1-minute scalp, typically 0.15–0.25% below entry on SPY.
Take-profit:
Aim for a 1:1.5 or 1:2 reward/risk ratio, or exit near resistance/VWAP.
3. Entry for Short (PUT) Trades
When you see a red triangle (triangle down) above a candle:
Confirm the setup:
The composite line is turning down (red).
Price is below the composite line or crossing under.
RSI < 45 and falling.
Volume is elevated.
Entry timing:
Enter on candle close of the signal bar.
Conservative: confirm with next candle closing lower.
Stop-loss:
Just above the composite line or previous swing high.
Take-profit:
Same 1:1.5–1:2 risk/reward ratio, or exit near support/VWAP.
4. Optional: Multi-Timeframe Confirmation
You can use:
1m chart for entries.
5m chart to confirm the broader direction (if 5m trend matches 1m signal → stronger confluence).
If your 1m chart shows a CALL signal and the 5m EMAs are bullish too, it’s a higher-probability trade.
Protected script
This script is published as closed-source. However, you can use it freely and without any limitations – learn more here.
Disclaimer
The information and publications are not meant to be, and do not constitute, financial, investment, trading, or other types of advice or recommendations supplied or endorsed by TradingView. Read more in the Terms of Use.