OPEN-SOURCE SCRIPT
Updated Classic_Levels
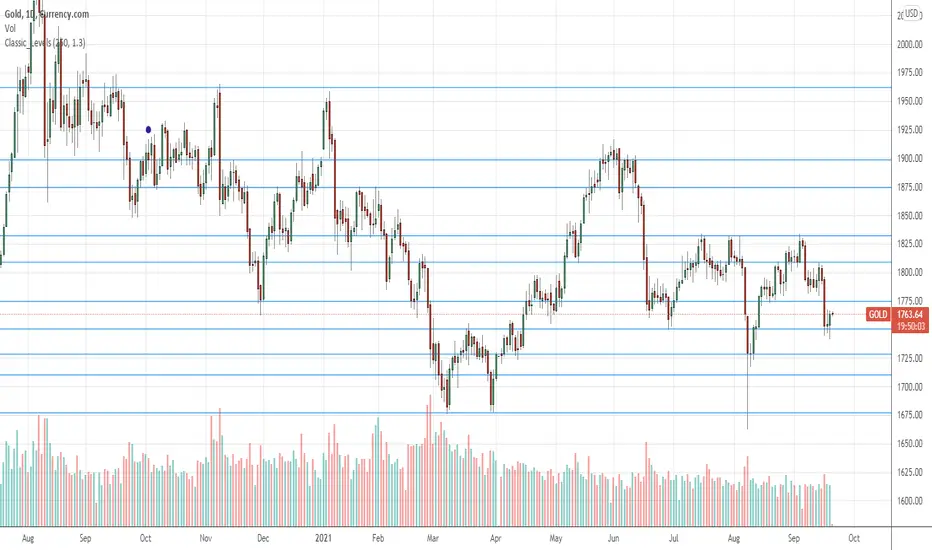
Displays horizontal lines that represent support and resistance levels.
You can use it with any symbol and on any timeframe.
Parameter 'Time range' means number of candles in consideration. The beginning of the range is marked with a little violet circle.
The more 'Sensitivity' is, the more levels are displayed.
You can use it with any symbol and on any timeframe.
Parameter 'Time range' means number of candles in consideration. The beginning of the range is marked with a little violet circle.
The more 'Sensitivity' is, the more levels are displayed.
Release Notes
Little changes in comments and variable names.Release Notes
Some internal coefficients changed.Release Notes
***Release Notes
Little corrections to the algorithm.Release Notes
Increased performance.Release Notes
Function was removed.Release Notes
Array used.Release Notes
Algorithm slightly changed, performance improved.Open-source script
In true TradingView spirit, the creator of this script has made it open-source, so that traders can review and verify its functionality. Kudos to the author! While you can use it for free, remember that republishing the code is subject to our House Rules.
Disclaimer
The information and publications are not meant to be, and do not constitute, financial, investment, trading, or other types of advice or recommendations supplied or endorsed by TradingView. Read more in the Terms of Use.
Open-source script
In true TradingView spirit, the creator of this script has made it open-source, so that traders can review and verify its functionality. Kudos to the author! While you can use it for free, remember that republishing the code is subject to our House Rules.
Disclaimer
The information and publications are not meant to be, and do not constitute, financial, investment, trading, or other types of advice or recommendations supplied or endorsed by TradingView. Read more in the Terms of Use.