OPEN-SOURCE SCRIPT
Updated Tandem EMA Trends
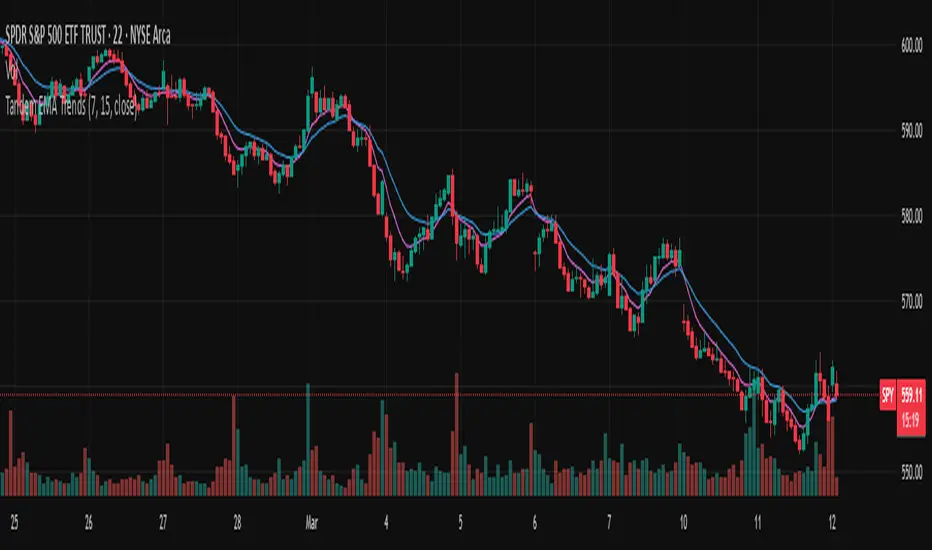
This indicator helps to identify trends using 2 (tandem) EMAs: a fast EMA and a slow EMA. Set the lengths of the EMAs in the inputs (fast EMA should be a smaller number than the slow EMA).
The trend is bullish if the current value of the fast EMA > current value of the slow EMA AND the current value of the fast EMA > the prior bar's value of the fast EMA.
The trend is bearish if the current value of the fast EMA < current value of the slow EMA AND the current value of the fast EMA < the prior bar's value of the fast EMA.
The fast EMA is countertrend to the slow EMA if either of the following 2 conditions exist:
The current value of the fast EMA > current value of the slow EMA AND the current value of the fast EMA < the prior bar's value of the fast EMA (bullish countertrend).
-OR-
The current value of the fast EMA < current value of the slow EMA AND the current value of the fast EMA > the prior bar's value of the fast EMA (bearish countertrend).
Use this script to set custom alerts based off of the current trend like sending webhooks when specific conditions exist.
Customize the colors of the plots.
Release Notes
Added a checkbox for "Market hours only"Open-source script
In true TradingView spirit, the creator of this script has made it open-source, so that traders can review and verify its functionality. Kudos to the author! While you can use it for free, remember that republishing the code is subject to our House Rules.
Disclaimer
The information and publications are not meant to be, and do not constitute, financial, investment, trading, or other types of advice or recommendations supplied or endorsed by TradingView. Read more in the Terms of Use.
Open-source script
In true TradingView spirit, the creator of this script has made it open-source, so that traders can review and verify its functionality. Kudos to the author! While you can use it for free, remember that republishing the code is subject to our House Rules.
Disclaimer
The information and publications are not meant to be, and do not constitute, financial, investment, trading, or other types of advice or recommendations supplied or endorsed by TradingView. Read more in the Terms of Use.