OPEN-SOURCE SCRIPT
Z-Score Triggered VWAP

# Z-Score Triggered VWAP Indicator
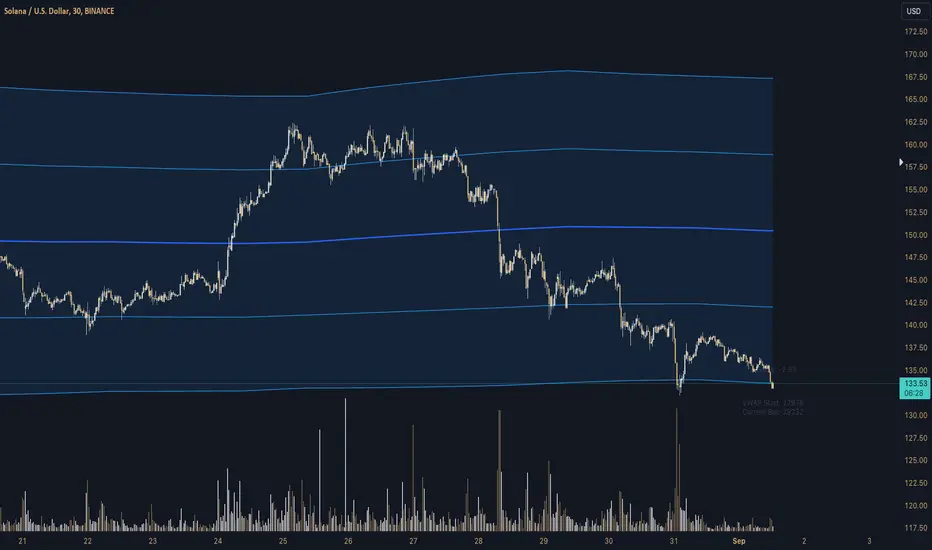
This custom indicator combines Volume-Weighted Average Price (VWAP) with Z-Score analysis to create a dynamic, volume-sensitive trading tool. It's designed to identify significant volume events and adjust the VWAP calculation accordingly, providing traders with a more responsive and adaptive price average.
## Key Features:
1. **Z-Score Triggered VWAP**: The indicator calculates a new VWAP when the volume Z-Score crosses above a user-defined threshold, allowing it to adapt to significant volume events.
2. **Customizable Timeframes**: Users can set different timeframes for Z-Score calculation and VWAP plotting, enabling multi-timeframe analysis.
3. **Dynamic Bands**: The indicator plots two sets of bands around the VWAP, calculated using standard deviation multipliers, which can be customized by the user.
4. **Visual Cues**: New VWAP start points are marked with yellow circles, helping traders identify where calculations reset.
5. **Real-time Information**: The current Z-Score and VWAP start information are displayed on the chart, providing immediate context.
6. **Flexible Appearance**: Users can customize colors and choose whether to display bands, enhancing chart readability.
7. **Multiple Alert Conditions**: The indicator includes alert conditions for price crossovers of the VWAP and all band levels.
## How It Works:
1. The indicator calculates the volume Z-Score on a user-specified timeframe, comparing current volume to historical volume over a lookback period.
2. When the volume Z-Score exceeds the threshold, a new VWAP calculation is triggered, resetting the cumulative values used in the VWAP formula.
3. The VWAP is continuously calculated and plotted on the chart, along with upper and lower bands based on price deviation from the VWAP.
4. Traders can use the VWAP line and bands to identify potential support/resistance levels and overbought/oversold conditions.
5. The Z-Score trigger helps ensure that the VWAP remains relevant by adapting to significant changes in trading volume.
## Trading Applications:
- **Dynamic Support/Resistance**: Use the VWAP and bands as potential support and resistance levels that adapt to changing market conditions.
- **Trend Identification**: The slope of the VWAP can help identify the overall trend direction.
- **Mean Reversion**: Look for potential reversals when price reaches the outer bands.
- **Volume Analysis**: The Z-Score trigger points highlight periods of unusual volume, which may precede significant price moves.
- **Risk Management**: Use the bands as potential stop-loss or take-profit levels.
This indicator is suitable for traders who want a more dynamic alternative to traditional VWAP indicators, especially those trading in markets with variable volume patterns. It combines volume analysis with price action, providing a comprehensive view of market behaviour
Open-source script
In true TradingView spirit, the creator of this script has made it open-source, so that traders can review and verify its functionality. Kudos to the author! While you can use it for free, remember that republishing the code is subject to our House Rules.
Disclaimer
The information and publications are not meant to be, and do not constitute, financial, investment, trading, or other types of advice or recommendations supplied or endorsed by TradingView. Read more in the Terms of Use.