MTF Dots Cor[Intromoto]
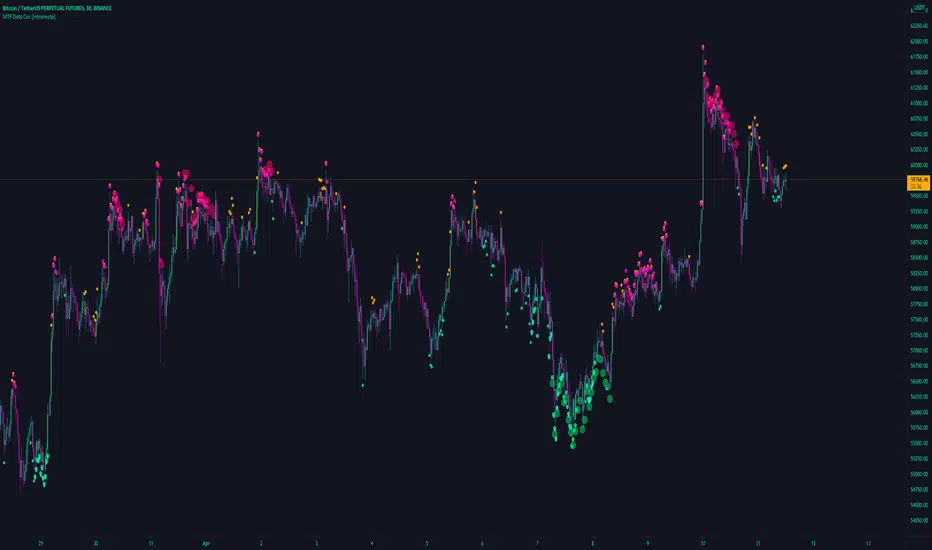
This indicator shows an MTF RSI levels via the dots above and below candles of a separate security. For example, type BTCUSDT into the ticker field and your chart will show the respective RSI levels for BTDUSDT, independent of your observed chart. This essentially shows RSI correlation to another asset.
There is also an MTF function in the settings to show the timeframe for the RSI oversold/overbought conditions.
DM for access.
Invite-only script
Only users approved by the author can access this script. You'll need to request and get permission to use it. This is typically granted after payment. For more details, follow the author's instructions below or contact Intromoto directly.
TradingView does NOT recommend paying for or using a script unless you fully trust its author and understand how it works. You may also find free, open-source alternatives in our community scripts.
Author's instructions
Follow on Twitter for updates.
One time fee, no subscription
twitter.com/IntroMoto
Disclaimer
Invite-only script
Only users approved by the author can access this script. You'll need to request and get permission to use it. This is typically granted after payment. For more details, follow the author's instructions below or contact Intromoto directly.
TradingView does NOT recommend paying for or using a script unless you fully trust its author and understand how it works. You may also find free, open-source alternatives in our community scripts.
Author's instructions
Follow on Twitter for updates.
One time fee, no subscription
twitter.com/IntroMoto