PROTECTED SOURCE SCRIPT
Custom MACD
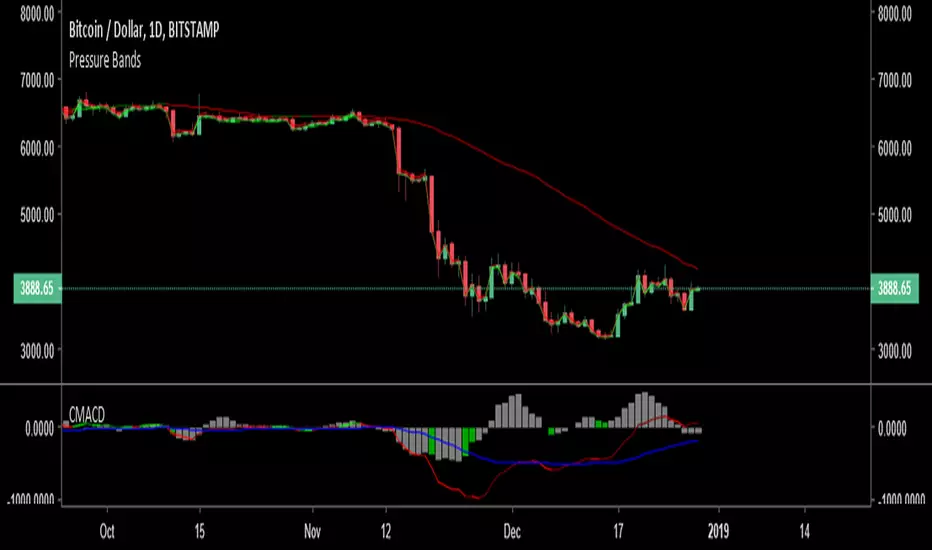
Multi indication MACD , the macd coloring indicates when the trend is aligned with the indicator direction , the macd signal line measure's market sentiment blue for bearish yellow for bullish , the histogram works off rate of change rather then the cross over and color of the histogram indicates possible bull or bear reversal of trend
Protected script
This script is published as closed-source. However, you can use it freely and without any limitations – learn more here.
Disclaimer
The information and publications are not meant to be, and do not constitute, financial, investment, trading, or other types of advice or recommendations supplied or endorsed by TradingView. Read more in the Terms of Use.