OPEN-SOURCE SCRIPT
Vertical and Horizontal Lines on given Dates

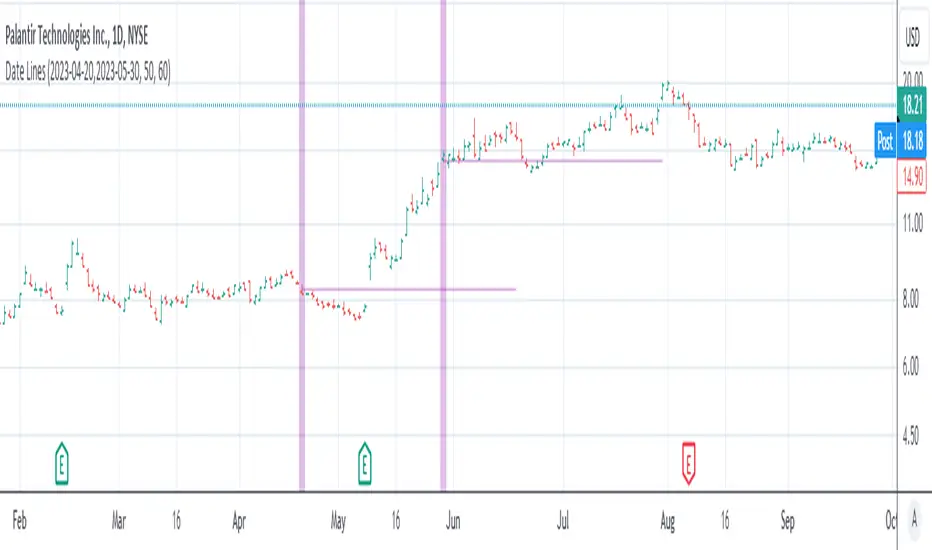
This simple indicator is to show the impact of given dates on the chart:
The dates need to be entered in a yyyy-MM-dd format, separated by comma (,) or space+comma ( ,).
The event can be shown on the chart with a vertical highlighting.
The midpoint of the price action that day can be shown as a vertical line.
Hint: If you load a lot of dates into it, best disable the "Indicator Arguments" in "Chart Settings" -> "Status line" to not have the chart littered with these date arguments.
Open-source script
In true TradingView spirit, the creator of this script has made it open-source, so that traders can review and verify its functionality. Kudos to the author! While you can use it for free, remember that republishing the code is subject to our House Rules.
Disclaimer
The information and publications are not meant to be, and do not constitute, financial, investment, trading, or other types of advice or recommendations supplied or endorsed by TradingView. Read more in the Terms of Use.