OPEN-SOURCE SCRIPT
RSI OverBought/Sold Price Predict
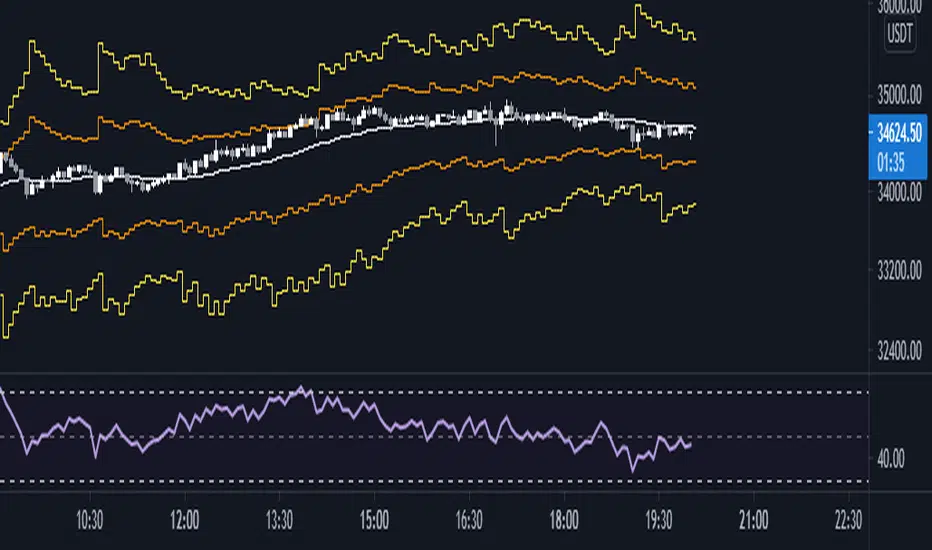
Using the RSI formula, predict what price should be next to be oversold or overbought.
For using support and resistance, turn on "smoothing" option.
White Line = what price should be next to be RSI = 50.
Orange Line = what price should be next to be RSI = 70 or 30 (Default)
Yellow Line = what price should be next to be RSI = 80 or 20 (Default)
Green Line = what price should be next to be RSI = 90 or 10 (Default)
Open-source script
In true TradingView spirit, the creator of this script has made it open-source, so that traders can review and verify its functionality. Kudos to the author! While you can use it for free, remember that republishing the code is subject to our House Rules.
Disclaimer
The information and publications are not meant to be, and do not constitute, financial, investment, trading, or other types of advice or recommendations supplied or endorsed by TradingView. Read more in the Terms of Use.