OPEN-SOURCE SCRIPT
Updated Crypto Tripple RSI
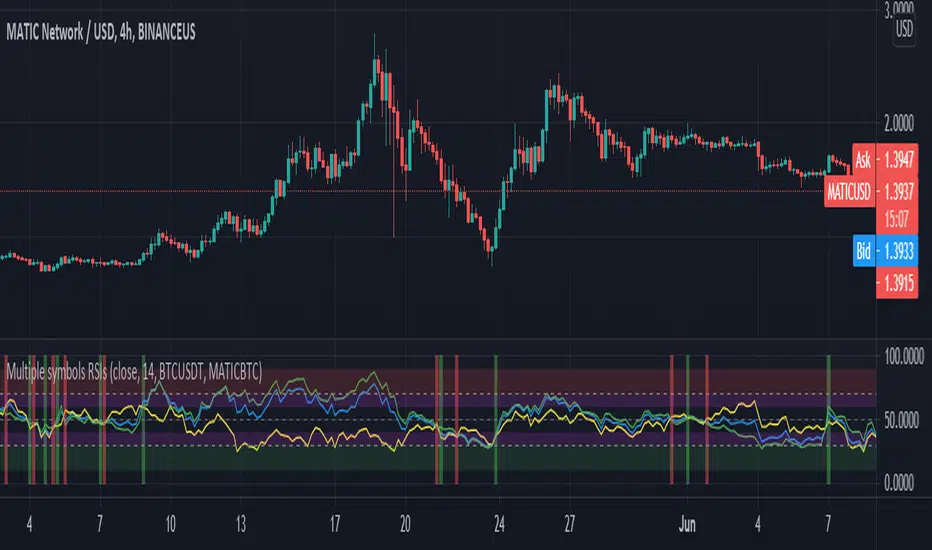
Gives an ability to compare 3 RSIs:
It helps to understand the cause of price change - whether BTC provokes price change or not. Also it shows performance of an altcoin - the bigger gaps between RSIs, the stronger (RSI of BTC is on the bottom)/ weaker (RSI of BTC is on the top) altcoin is.
- current altcoin + BTC (e.g. ADABTC) - green by default
- current pair (e.g. ADAUSDT) - blue by default
- BTC (e.g. BTCUSDT) - yellow by default
It helps to understand the cause of price change - whether BTC provokes price change or not. Also it shows performance of an altcoin - the bigger gaps between RSIs, the stronger (RSI of BTC is on the bottom)/ weaker (RSI of BTC is on the top) altcoin is.
Release Notes
Just moved `transp` argument (obsolete soon) into `color.new`Release Notes
- Add important levels (explanation link in the code)
- Add alerts
- Add markers, when X RSI crosses up or down BTC RSI
Release Notes
Some cryptocurrencies has no pair with BTC which caused errors. I have added ability to choose second and third source of RSIs (formerly BTC RSI and X_BTC RSI). Besides the third RSI is hidden by default because there is no way to dynamically set third source in settings. But now it is universal and you can use it not only with cryptocurrencies :) Release Notes
- New levels: 80 and 20
- Additional lines: 75 and 25
- Ability to change resolution of #2 and #3 RSI
- Separate source and length for all RSIs
Release Notes
- New RSI: "Additional current RSI" - to compare current RSI with different timeframe
Open-source script
In true TradingView spirit, the creator of this script has made it open-source, so that traders can review and verify its functionality. Kudos to the author! While you can use it for free, remember that republishing the code is subject to our House Rules.
Disclaimer
The information and publications are not meant to be, and do not constitute, financial, investment, trading, or other types of advice or recommendations supplied or endorsed by TradingView. Read more in the Terms of Use.