PROTECTED SOURCE SCRIPT
1k TICK arrows
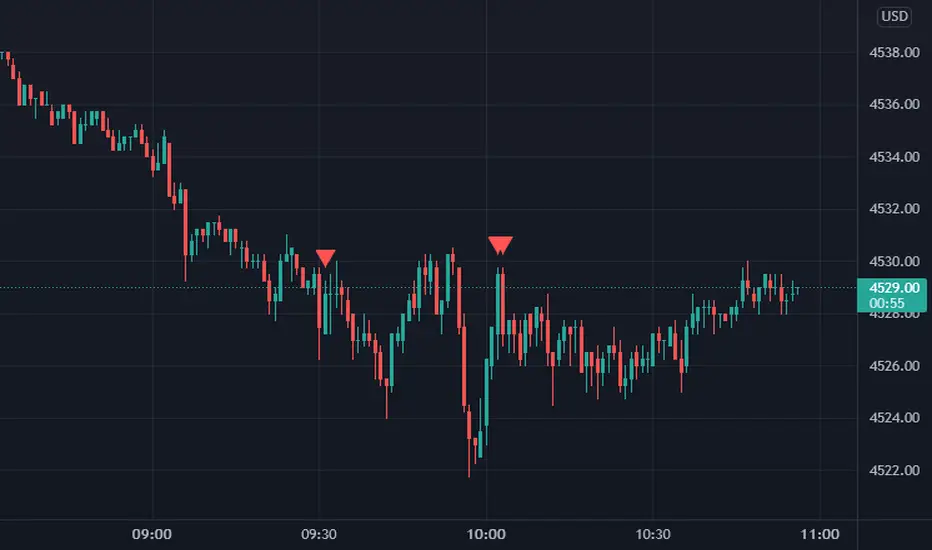
This plots green up arrows when the TICK index goes to -1,000 or lower or red down arrows when the TICK index goes +1,000 or higher. Can be used as a short term reversal signal (not investment advice). Will unfortunately plot on all charts but should only be relevant for US equity indices, mainly S&P500/ES futures. Indicator will adapt to the charts time frame and is hard coded to only show during 9:30-16:00 EST.
Protected script
This script is published as closed-source. However, you can use it freely and without any limitations – learn more here.
Disclaimer
The information and publications are not meant to be, and do not constitute, financial, investment, trading, or other types of advice or recommendations supplied or endorsed by TradingView. Read more in the Terms of Use.