OPEN-SOURCE SCRIPT
RedK_Fibonacci on Doncian (RedK_FibDC_v1)
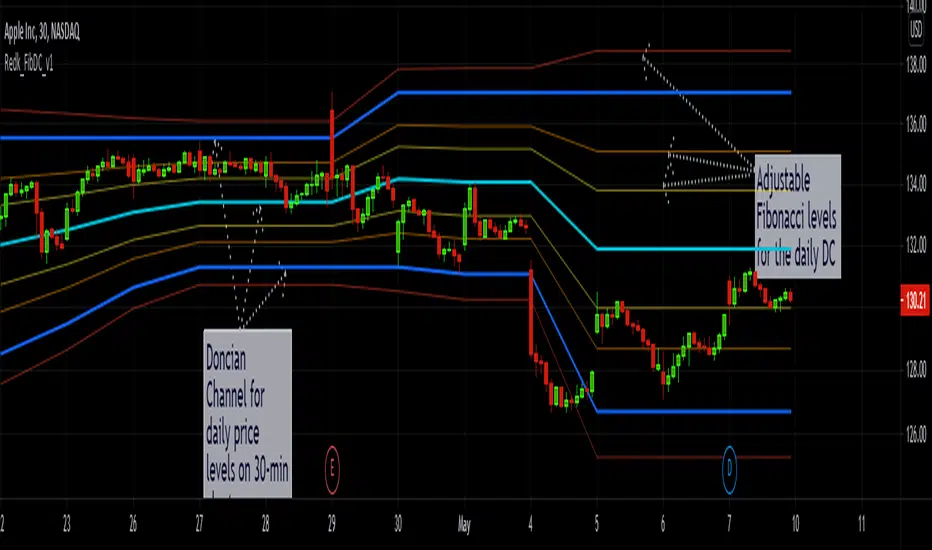
this is a quick script that gives the ability to plot a simple Doncian Channel with optional Fibonacci levels calculated against the DC channel breadth.
a Doncian channel is simply a channel that represents the highest high and lowest low of the price for a certain period (number of bars) -- the concept of watching these extreme values is the basis of many other technical indicators in chart analysis.
A script like this may come useful for setting entry and exit levels and can be used to plot the DC & Fib levels for a higher resolution than the chart - in the example, we're looking at the DC & its Fib levels for the daily resolution on a 30-min chart.
there are 3 adjustable levels that are set by default to 0.368, 0.618, and 1.272 -- and they can be set to any other levels we need to monitor - not necessarily Fib-based at all - say to determine a possible breakout or breakdown... etc
this script makes use of the "resolution" and "inline / group" features (powers) of Pine :)
Open-source script
In true TradingView spirit, the creator of this script has made it open-source, so that traders can review and verify its functionality. Kudos to the author! While you can use it for free, remember that republishing the code is subject to our House Rules.
Disclaimer
The information and publications are not meant to be, and do not constitute, financial, investment, trading, or other types of advice or recommendations supplied or endorsed by TradingView. Read more in the Terms of Use.