OPEN-SOURCE SCRIPT
RSI+
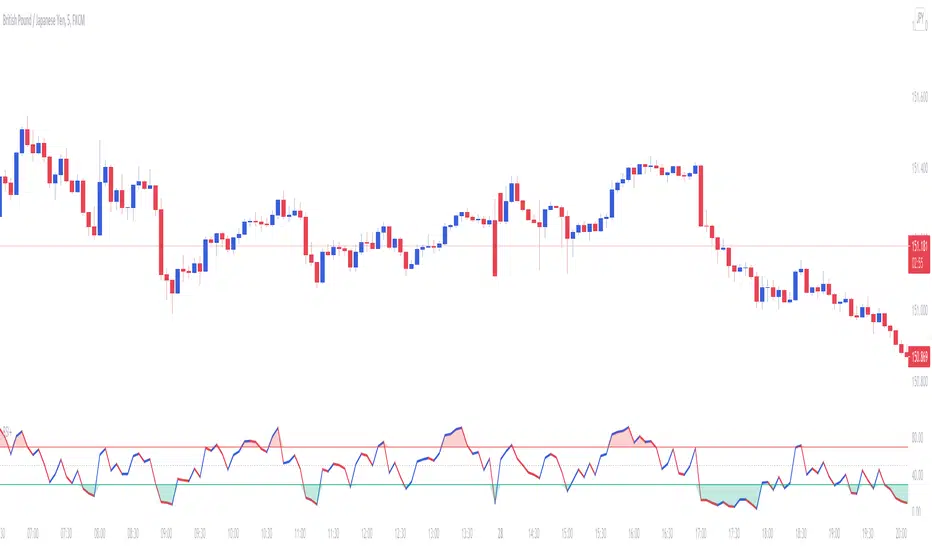
The Relative Strength Index can be used to determine Overbought and Oversold market conditions. This RSI+ indicator is set to a length faster then normal and changes color depending on momentum. When the RSI is Overbought a red shadow appears to indicate a sell is setting up. When the RSI is Oversold a green shadow appears to indicate a buy is setting up
Open-source script
In true TradingView spirit, the creator of this script has made it open-source, so that traders can review and verify its functionality. Kudos to the author! While you can use it for free, remember that republishing the code is subject to our House Rules.
Disclaimer
The information and publications are not meant to be, and do not constitute, financial, investment, trading, or other types of advice or recommendations supplied or endorsed by TradingView. Read more in the Terms of Use.