OPEN-SOURCE SCRIPT
Updated ARVELOV MACD with Zones
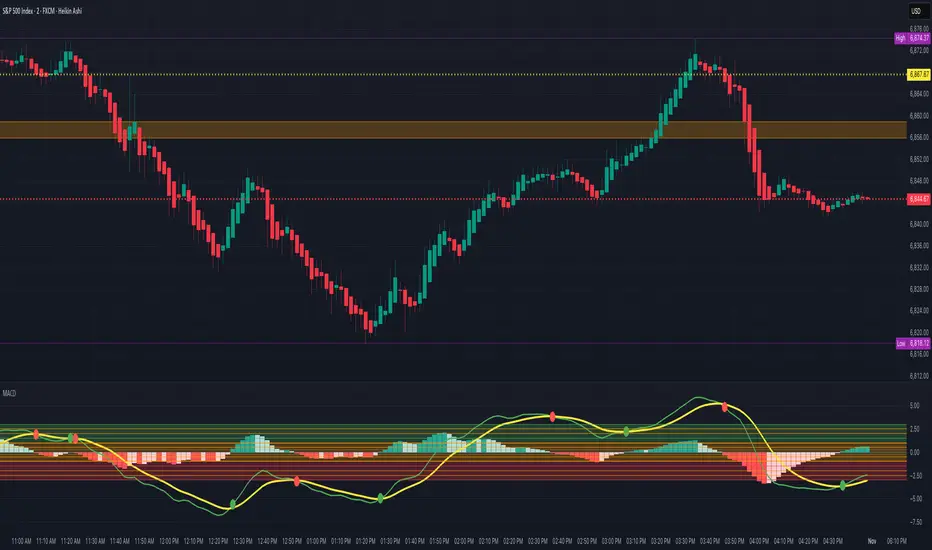
This TradingView Pine Script (version 5) is a custom MACD (Moving Average Convergence Divergence) indicator. It calculates the MACD line by subtracting a slow moving average from a fast moving average, using either an EMA or SMA depending on user settings. A signal line—also selectable as an EMA or SMA—is then derived from the MACD, and the histogram plots the difference between the two. The script visually enhances the traditional MACD by coloring the histogram columns dynamically: shades of green for strengthening bullish momentum and shades of red for weakening or strengthening bearish momentum.
Beyond standard MACD plotting, the script adds multiple horizontal reference lines (from ±0.25 up to ±3) and color-filled zones to highlight momentum regions: an orange box for the neutral range (−1 to +1), a red zone for strong bearish momentum (−3 to −1), and a green zone for strong bullish momentum (+1 to +3). It includes alerts and visual dots for key events—when the MACD crosses its signal line (bullish or bearish crossovers) and when the histogram changes slope (rising to falling or vice versa). Altogether, this enhanced MACD aims to make momentum shifts and overextended conditions easier to identify visually and programmatically for alert-based trading strategies.
Beyond standard MACD plotting, the script adds multiple horizontal reference lines (from ±0.25 up to ±3) and color-filled zones to highlight momentum regions: an orange box for the neutral range (−1 to +1), a red zone for strong bearish momentum (−3 to −1), and a green zone for strong bullish momentum (+1 to +3). It includes alerts and visual dots for key events—when the MACD crosses its signal line (bullish or bearish crossovers) and when the histogram changes slope (rising to falling or vice versa). Altogether, this enhanced MACD aims to make momentum shifts and overextended conditions easier to identify visually and programmatically for alert-based trading strategies.
Release Notes
This TradingView Pine Script (version 5) is a custom MACD (Moving Average Convergence Divergence) indicator. It calculates the MACD line by subtracting a slow moving average from a fast moving average, using either an EMA or SMA depending on user settings. A signal line—also selectable as an EMA or SMA—is then derived from the MACD, and the histogram plots the difference between the two. The script visually enhances the traditional MACD by coloring the histogram columns dynamically: shades of green for strengthening bullish momentum and shades of red for weakening or strengthening bearish momentum.Beyond standard MACD plotting, the script adds multiple horizontal reference lines (from ±0.25 up to ±3) and color-filled zones to highlight momentum regions: an orange box for the neutral range (−1 to +1), a red zone for strong bearish momentum (−3 to −1), and a green zone for strong bullish momentum (+1 to +3). It includes alerts and visual dots for key events—when the MACD crosses its signal line (bullish or bearish crossovers) and when the histogram changes slope (rising to falling or vice versa). Altogether, this enhanced MACD aims to make momentum shifts and overextended conditions easier to identify visually and programmatically for alert-based trading strategies.
Open-source script
In true TradingView spirit, the creator of this script has made it open-source, so that traders can review and verify its functionality. Kudos to the author! While you can use it for free, remember that republishing the code is subject to our House Rules.
Disclaimer
The information and publications are not meant to be, and do not constitute, financial, investment, trading, or other types of advice or recommendations supplied or endorsed by TradingView. Read more in the Terms of Use.