OPEN-SOURCE SCRIPT
Momentum Shift Oscillator (MSO) [SharpStrat]

Momentum Shift Oscillator (MSO)
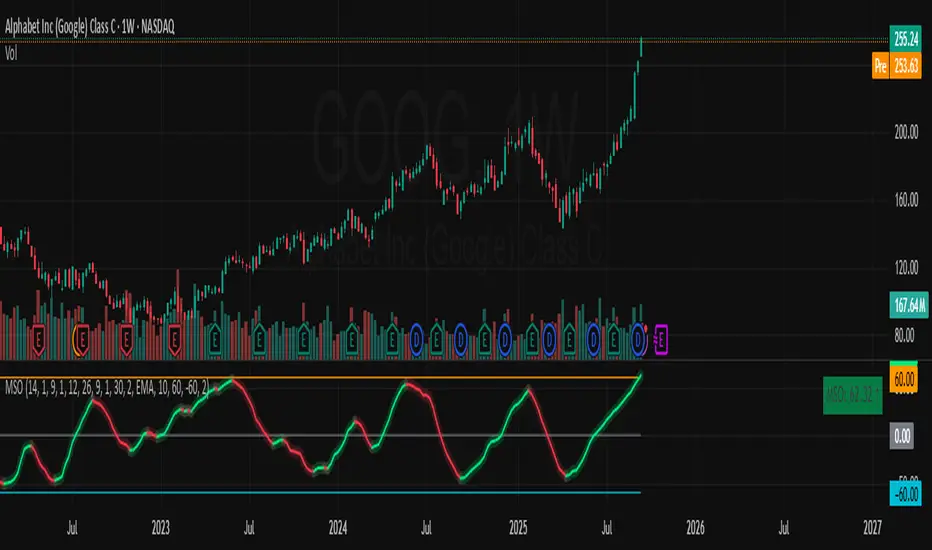
The Momentum Shift Oscillator (MSO) is a custom-built oscillator that combines the best parts of RSI, ROC, and MACD into one clean, powerful indicator. Its goal is to identify when momentum shifts are happening in the market, filtering out noise that a single momentum tool might miss.
Why MSO?
Most traders rely on just one momentum indicator like RSI, MACD, or ROC. Each has strengths, but also weaknesses:
By blending all three (with adjustable weights), MSO gives a balanced view of momentum. It captures trend strength, velocity, and exhaustion in one oscillator.
How MSO Works
Inputs:
How to trade with MSO
Why MSO is Unique
The Momentum Shift Oscillator (MSO) is a custom-built oscillator that combines the best parts of RSI, ROC, and MACD into one clean, powerful indicator. Its goal is to identify when momentum shifts are happening in the market, filtering out noise that a single momentum tool might miss.
Why MSO?
Most traders rely on just one momentum indicator like RSI, MACD, or ROC. Each has strengths, but also weaknesses:
- RSI → great for overbought/oversold, but often lags in strong trends.
- ROC (Rate of Change) → captures price velocity, but can be too noisy.
- MACD Histogram → shows trend strength shifts, but reacts slowly at times.
By blending all three (with adjustable weights), MSO gives a balanced view of momentum. It captures trend strength, velocity, and exhaustion in one oscillator.
How MSO Works
Inputs:
- RSI, ROC, and MACD Histogram are calculated with user-defined lengths.
- Each is normalized (so they share the same scale of -100 to +100).
- You can set weights for RSI, ROC, and MACD to emphasize different components.
- The components are blended into a single oscillator value.
- Smoothing (SMA, EMA, or WMA) is applied.
- MSO plots as a smooth line, color-coded by slope (green rising, red falling).
- Overbought and oversold levels are plotted (default: +60 / -60).
- A zero line helps identify bullish vs bearish momentum shifts.
How to trade with MSO
- Zero line crossovers → crossing above zero suggests bullish momentum; crossing below zero suggests bearish momentum.
- Overbought and oversold zones → values above +60 may indicate exhaustion in bullish moves; values below -60 may signal exhaustion in bearish moves.
- Slope of the line → a rising line shows strengthening momentum, while a falling line signals fading momentum.
- Divergences → if price makes new highs or lows but MSO does not, it can point to a possible reversal.
Why MSO is Unique
- Combines trend + momentum + velocity into one view.
- Filters noise better than standalone RSI/MACD.
- Adapts to both trend-following and mean-reversion styles.
- Can be used across any timeframe for confirmation.
Open-source script
In true TradingView spirit, the creator of this script has made it open-source, so that traders can review and verify its functionality. Kudos to the author! While you can use it for free, remember that republishing the code is subject to our House Rules.
I create free Trading View indicators for the community. Your idea could be next! Submit → forms.gle/aE69zwHrfASScj8T7
Disclaimer
The information and publications are not meant to be, and do not constitute, financial, investment, trading, or other types of advice or recommendations supplied or endorsed by TradingView. Read more in the Terms of Use.