OPEN-SOURCE SCRIPT
Updated Kijun-Sen Line
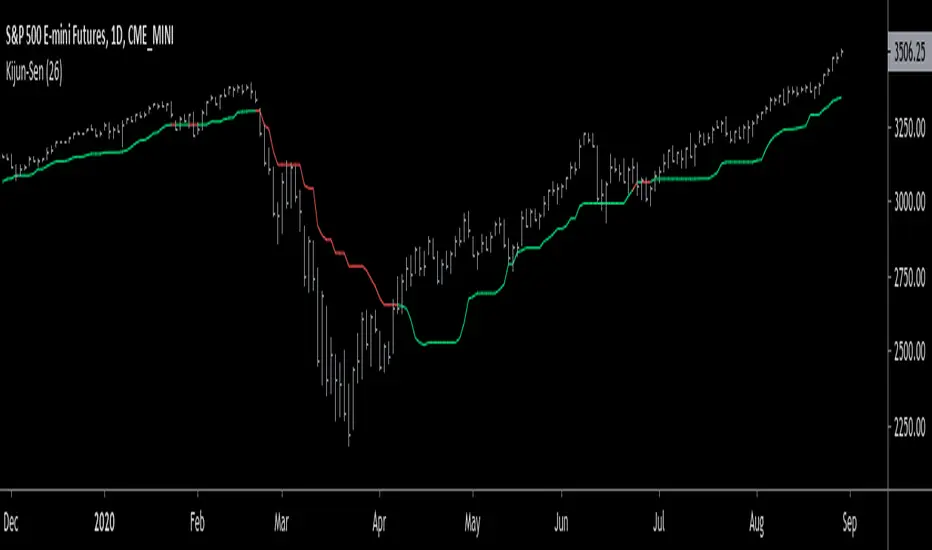
The Kijun-Sen line is an indicator that helps to identify the trend; whether that's up or down.
When the line is...
Green - Market is in an uptrend
Red - Market is in a downtrend
Recommended settings: 20 - 37 (26 is best)
The Kijun-Sen line, otherwise known as Baseline is simply the middle price between the highest high & the lowest low over a given period of time.
Calculation: (Highest high + lowest low)/2 = Baseline (Kijun-Sen)
The Kijun-Sen line was developed by Japanese journalist, Goichi Hosoda in the late 1960s. It was part of an indicator called the Ichimoku Cloud, an entire trend-trading system developed by the journalist himself. In my opinion, the Kijun-Sen is the most important part of the system.
Special thanks to VP & his Nononsense Forex Youtube Channel!
Release Notes
>>>Chg green to lime.
Open-source script
In true TradingView spirit, the creator of this script has made it open-source, so that traders can review and verify its functionality. Kudos to the author! While you can use it for free, remember that republishing the code is subject to our House Rules.
Disclaimer
The information and publications are not meant to be, and do not constitute, financial, investment, trading, or other types of advice or recommendations supplied or endorsed by TradingView. Read more in the Terms of Use.