OPEN-SOURCE SCRIPT
real (colored) volume
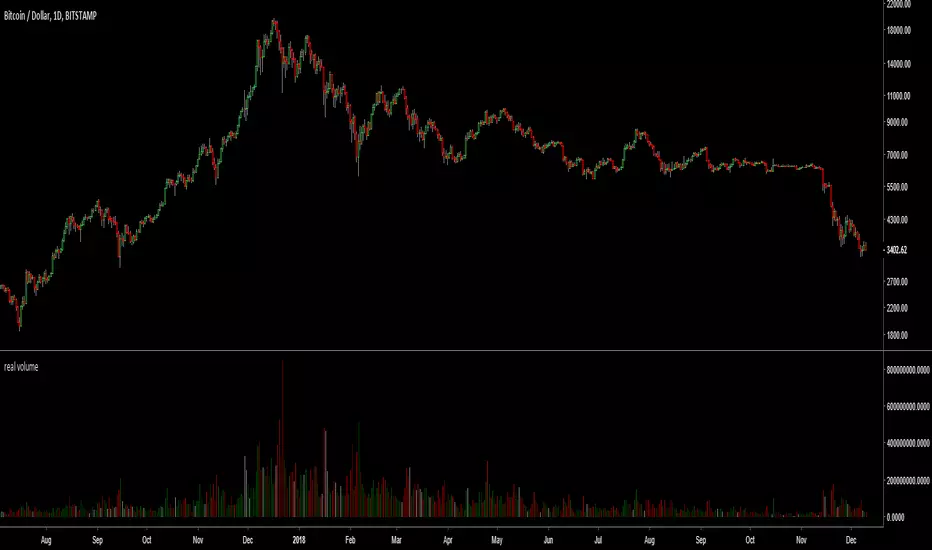
This script plots the volume in terms of the underlying base (e.g. USD or btc) not number of coins traded. It plots volume*mid price.
In addition, the volume color density depends on the candle body divided to high-low. Very green for long up candle body, grey means short candle body compared to high-low, very red for long down candle body. It may provide some indications of the strength of bulls versus bears.
In addition, the volume color density depends on the candle body divided to high-low. Very green for long up candle body, grey means short candle body compared to high-low, very red for long down candle body. It may provide some indications of the strength of bulls versus bears.
Open-source script
In true TradingView spirit, the creator of this script has made it open-source, so that traders can review and verify its functionality. Kudos to the author! While you can use it for free, remember that republishing the code is subject to our House Rules.
Disclaimer
The information and publications are not meant to be, and do not constitute, financial, investment, trading, or other types of advice or recommendations supplied or endorsed by TradingView. Read more in the Terms of Use.