OPEN-SOURCE SCRIPT
Updated KRMJ MA
overlays four moving averages on a TradingView chart to help traders identify trend direction, momentum shifts, and dynamic support or resistance levels. It includes a 9-period EMA, 21-period EMA, 20-period SMA, and a 200-period EMA. Each moving average serves a specific role: the 9 EMA responds quickly to price changes and highlights short-term momentum; the 21 EMA smooths out price action slightly more and confirms near-term trends. The 20 SMA provides a simple mid-range trend baseline often used in mean-reversion strategies or range-bound environments. The 200 EMA, a widely recognized long-term trend filter, helps users gauge the dominant market direction.
Release Notes
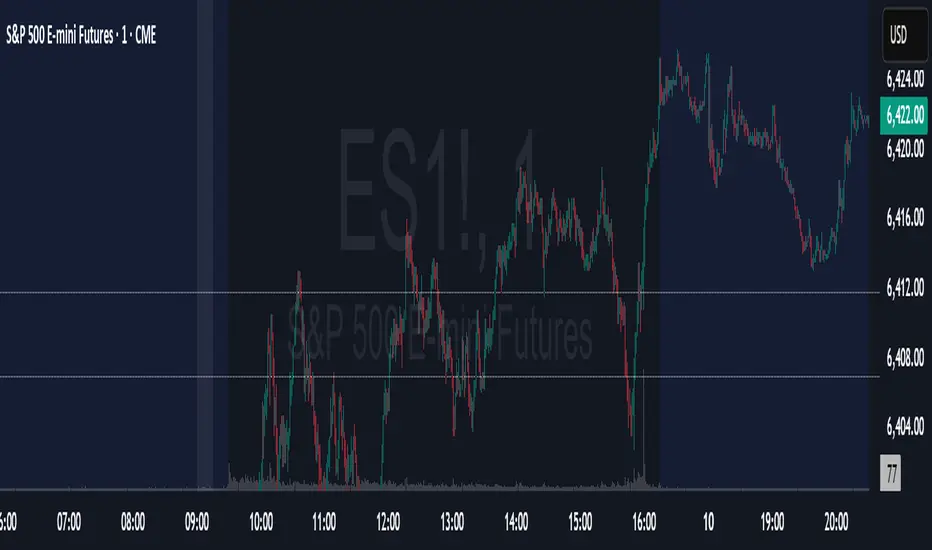
The KRMJ Indicator plots four hidden moving averages (13 EMA, 21 EMA, 20 SMA, 200 EMA) for reference, and automatically draws a light-blue dotted horizontal line each day from the 00:00 open price to 15:59, providing a clear visual reference for the day’s midnight session level.Open-source script
In true TradingView spirit, the creator of this script has made it open-source, so that traders can review and verify its functionality. Kudos to the author! While you can use it for free, remember that republishing the code is subject to our House Rules.
Disclaimer
The information and publications are not meant to be, and do not constitute, financial, investment, trading, or other types of advice or recommendations supplied or endorsed by TradingView. Read more in the Terms of Use.
Open-source script
In true TradingView spirit, the creator of this script has made it open-source, so that traders can review and verify its functionality. Kudos to the author! While you can use it for free, remember that republishing the code is subject to our House Rules.
Disclaimer
The information and publications are not meant to be, and do not constitute, financial, investment, trading, or other types of advice or recommendations supplied or endorsed by TradingView. Read more in the Terms of Use.