PROTECTED SOURCE SCRIPT
Updated MTF RSI Bounce+ [Intromoto]
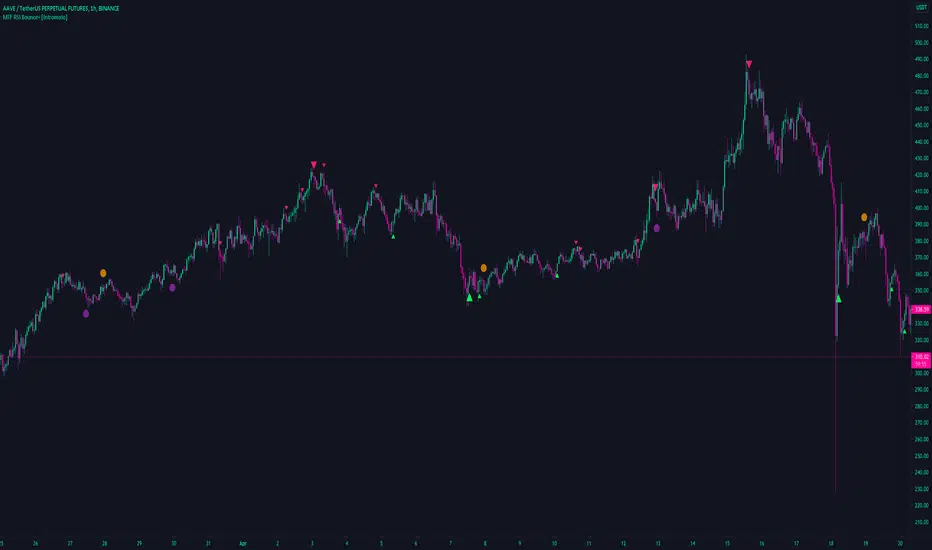
This script focuses on the relative strength index of an asset and plots shapes/lines based of "bounce" and crosses of the 50 midline
Barcoloring is based on the lower time frame over/under 50 for directional bias.
Smaller plotshapes are printed when the rsi "bounces" on the lower time frame 50, i.e is higher at first, lower on second, and back above the 50 on the 3rd close of the sequence.
Larger plotshapes occur on higher time frame, "D" by default, RSI crossovers. A line, user input styling available, is plotted horizontally for reference.
Alerts added for the HTF crossover/under
Thanks
Release Notes
Clarified inputs, removed HTF bounce. Styles changedRelease Notes
Changed default HTF resolution to 12HRelease Notes
Style settings and metrics changes. Added two more bounce sets, which abide by the same period length and chart resolution. Removed HTF bounce resolution. Protected script
This script is published as closed-source. However, you can use it freely and without any limitations – learn more here.
DM for access.
Follow on Twitter for updates.
One time fee, no subscription
twitter.com/IntroMoto
Follow on Twitter for updates.
One time fee, no subscription
twitter.com/IntroMoto
Disclaimer
The information and publications are not meant to be, and do not constitute, financial, investment, trading, or other types of advice or recommendations supplied or endorsed by TradingView. Read more in the Terms of Use.
Protected script
This script is published as closed-source. However, you can use it freely and without any limitations – learn more here.
DM for access.
Follow on Twitter for updates.
One time fee, no subscription
twitter.com/IntroMoto
Follow on Twitter for updates.
One time fee, no subscription
twitter.com/IntroMoto
Disclaimer
The information and publications are not meant to be, and do not constitute, financial, investment, trading, or other types of advice or recommendations supplied or endorsed by TradingView. Read more in the Terms of Use.