OPEN-SOURCE SCRIPT
Updated Historic High Lows Adaptive
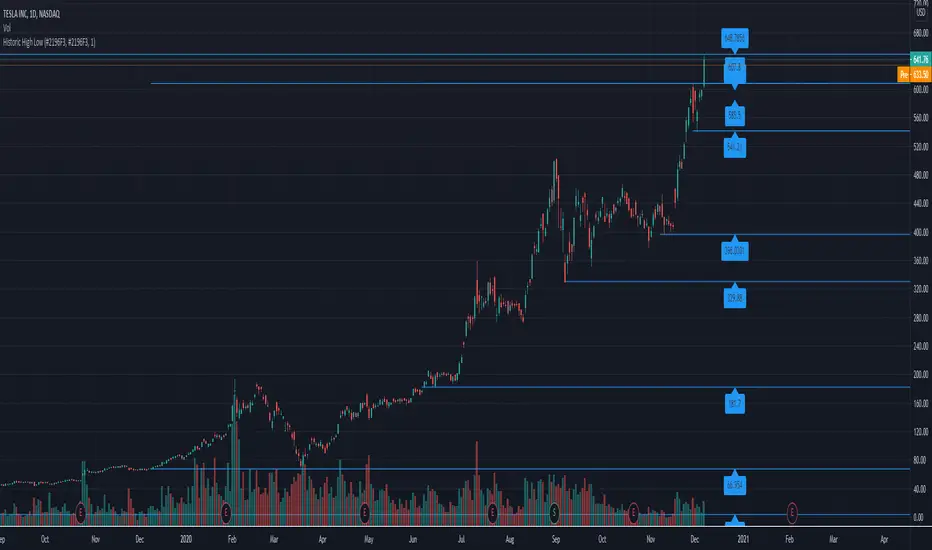
This will plot in the ticker opened:
-All-time High and Low
-1 Year High and Low
-6 Months High and Low
-3 Months High and Low
-1 Month High and Low
-1 Week High and Low
-Previous day High and Low
Colors, extending the line to the right, width, showing price tag are all parameters.
High and Low calculations are updated daily
Lines haves issues sometimes rendering when the candles are in a period too small.
Release Notes
Updated Script to fix issue where lines would be redrawn if a high or low are made on intraday. It should now only look at the past dates and prevent the line from redrawing till the next day.Open-source script
In true TradingView spirit, the creator of this script has made it open-source, so that traders can review and verify its functionality. Kudos to the author! While you can use it for free, remember that republishing the code is subject to our House Rules.
Disclaimer
The information and publications are not meant to be, and do not constitute, financial, investment, trading, or other types of advice or recommendations supplied or endorsed by TradingView. Read more in the Terms of Use.
Open-source script
In true TradingView spirit, the creator of this script has made it open-source, so that traders can review and verify its functionality. Kudos to the author! While you can use it for free, remember that republishing the code is subject to our House Rules.
Disclaimer
The information and publications are not meant to be, and do not constitute, financial, investment, trading, or other types of advice or recommendations supplied or endorsed by TradingView. Read more in the Terms of Use.