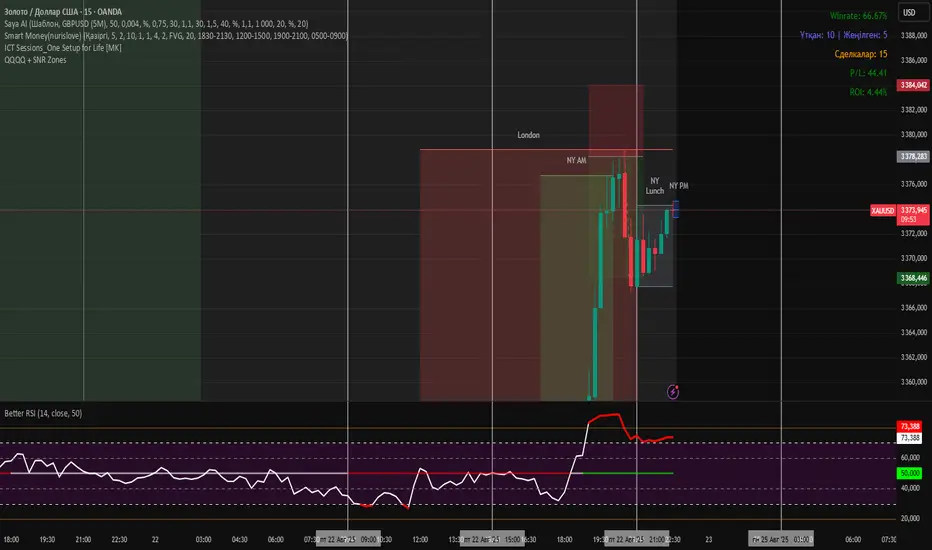
PROTECTED SOURCE SCRIPT
QQQQ 1W-1D Zhumabayevv

// === QQQQ Zone бөлігі ===
phaseDay = 24 * 60 * 60 * 1000
phase6h = 6 * 60 * 60 * 1000
week = 7 * phaseDay
getWeekStart() =>
dow = dayofweek
shift = (dow == dayofweek.sunday and hour >= 18) ? 0 : (dow == dayofweek.sunday ? -6 : 1 - dow)
timestamp("America/New_York", year, month, dayofmonth + shift, 18, 0)
var int weekStart = na
if na(weekStart) or time > weekStart + week
weekStart := getWeekStart()
isInQ1 = false
isInQ2 = false
isInQ3 = false
isInQ4 = false
showQ1 = false
showQ2 = false
showQ3 = false
showQ4 = false
for w = -1 to 2
baseTime = weekStart + w * week
for q = 0 to 3
qStart = baseTime + q * phaseDay
qEnd = qStart + phaseDay
inQ = time >= qStart and time < qEnd
if q == 0
isInQ1 := isInQ1 or inQ
showQ1 := showQ1 or (time == qStart)
if q == 1
isInQ2 := isInQ2 or inQ
showQ2 := showQ2 or (time == qStart)
if q == 2
isInQ3 := isInQ3 or inQ
showQ3 := showQ3 or (time == qStart)
if q == 3
isInQ4 := isInQ4 or inQ
showQ4 := showQ4 or (time == qStart)
for i = 1 to 3
t = qStart + i * phase6h
line.new(x1=t, y1=low, x2=t, y2=high, xloc=xloc.bar_time, extend=extend.both, color=color.gray, style=line.style_dashed, width=1)
plotshape(showQ1, location=location.top, style=shape.labelup, text="Q1", color=color.white, textcolor=color.black, size=size.tiny)
plotshape(showQ2, location=location.top, style=shape.labelup, text="Q2", color=color.white, textcolor=color.black, size=size.tiny)
plotshape(showQ3, location=location.top, style=shape.labelup, text="Q3", color=color.white, textcolor=color.black, size=size.tiny)
plotshape(showQ4, location=location.top, style=shape.labelup, text="Q4", color=color.white, textcolor=color.black, size=size.tiny)
bgColor = isInQ1 ? color.new(color.blue, 85) :
isInQ2 ? color.new(color.orange, 85) :
isInQ3 ? color.new(color.red, 85) :
isInQ4 ? color.new(color.green, 85) : na
bgcolor(bgColor)
Protected script
This script is published as closed-source. However, you can use it freely and without any limitations – learn more here.
Disclaimer
The information and publications are not meant to be, and do not constitute, financial, investment, trading, or other types of advice or recommendations supplied or endorsed by TradingView. Read more in the Terms of Use.