VTrend - Volume Script
The fundamental part of the script, is the volume weighted bands in blue and red, which help determine the trend and dynamic support and resistance. The blue band is a shorter length than the red band.
When the blue band dips below the red band, this tells us there is a downtrend. And when the blue band is trending above the red band, this is bullish uptrend price action. You will be able to note price whatever the timeframe really respects these bands, and you can use that to your advantage flicking through the high timeframes on where price will go next, combined with your own support and resistance levels.
https://www.tradingview.com/x/t1T79YhF/
The other most important aspects are the bar colors and the colored bollinger band line. Whenever price action is above the blue band the bars are green, when closing within the blue band, they are orange to show possible resistance or support. Below the blue band the bars are red for downtrend price action.
When the bars are bouncing off the daily open, a key level for you to play off everyday and makes it easier to gauge what price is doing, the bars are colored purple to highlight this.
The bollinger band line serves to act as a trendline, to help identify where price is going combined with the information above in the short term, and allows you to pick entry points more finely. There are also two bollinger band clouds in the background, which are areas to look at reversal or support for. You can turn these off if you wish, as not to clog up the chart.
Next feature up, are the reversal signals, which also double as areas to take profit. The default are the diamond reversal plots.
https://www.tradingview.com/x/qqClgNzG/
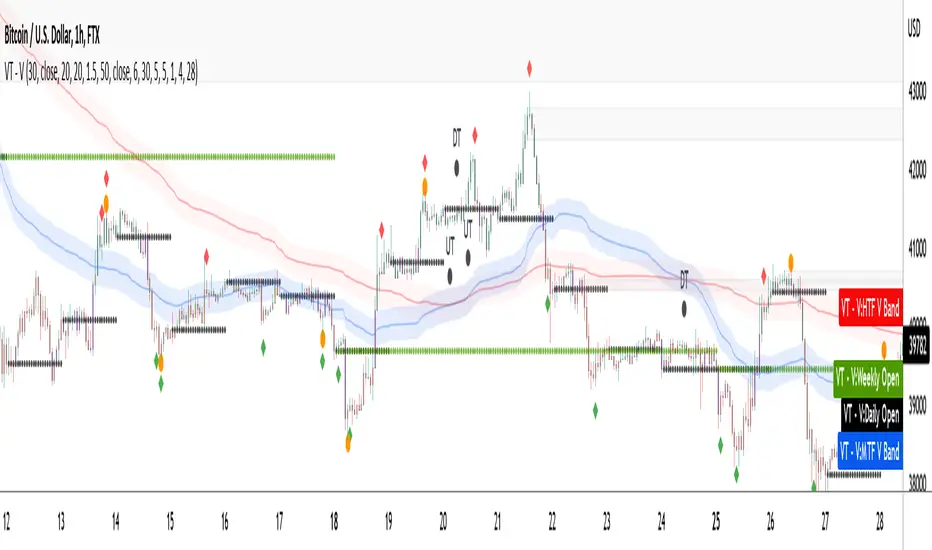
Enabled by default also are the custom leledc exhaustion plots, the major signals are enabled by default, whilst the minor signals are not turned on and are very noisy by comparison, especially at low timeframes.
You'll notice in the screenshot below, there is a black MA, that is an adjustable Hull Moving Average included for determining shorter term trend movements combined with the bollinger band colored line, depending on your trading style.
https://www.tradingview.com/x/rkiHlld5/
The image below shows when both major and minor leledc signals are turned on.
https://www.tradingview.com/x/2KirOKVG/
Also we have circular colored plots showing different reversal calculations, you can use them as a guide and take profit areas. These are based on candle type, and i consider them noisy especially at low time frames.
https://www.tradingview.com/x/BAAY7GHS/
The indicator is designed to give you key information, but be quite customisable as well to suit your exact trading style.
Recommended timeframes i use this on; Weekly (for key liquidity areas), Trading on the Daily, 6h, 4h, 2h, 1h, and 25 minutes.
- Updated to pinescript version 5
- Included Order blocks
Invite-only script
Only users approved by the author can access this script. You'll need to request and get permission to use it. This is typically granted after payment. For more details, follow the author's instructions below or contact vtrend-script directly.
TradingView does NOT recommend paying for or using a script unless you fully trust its author and understand how it works. You may also find free, open-source alternatives in our community scripts.
Author's instructions
Disclaimer
Invite-only script
Only users approved by the author can access this script. You'll need to request and get permission to use it. This is typically granted after payment. For more details, follow the author's instructions below or contact vtrend-script directly.
TradingView does NOT recommend paying for or using a script unless you fully trust its author and understand how it works. You may also find free, open-source alternatives in our community scripts.