OPEN-SOURCE SCRIPT
Updated Pickledeggtradermans RSI MA
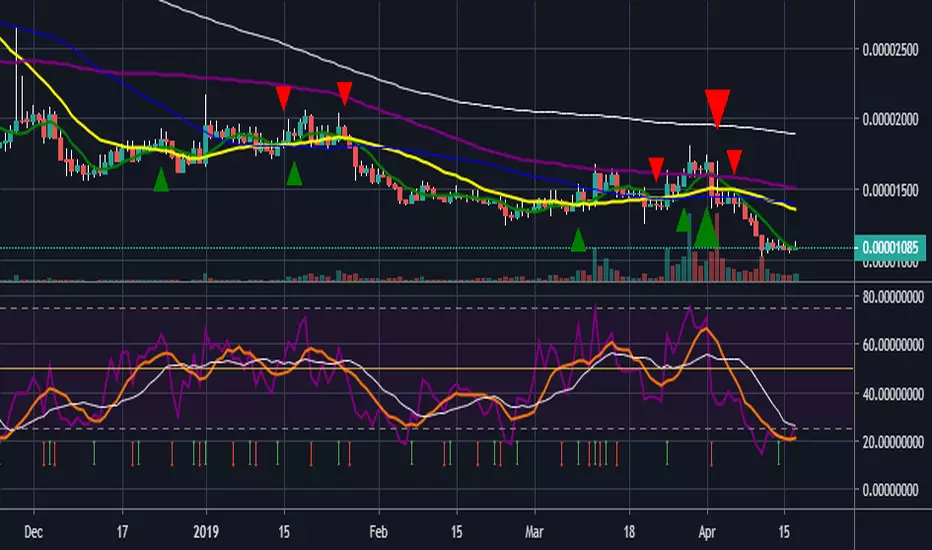
Hey guys just published another script that allows you to plot 3 sma's onto the RSI chart. Firstly the RSI close input is set to 7. the first sma is set at one in purple which is the current RSI level. Second MA is set at 7 and in orange, third and fourth ma's set to 14 and 21 in white and green respectively. Overbought/Oversold levels set at 75/25 with a midline at 50. These can all be tweaked to your liking. Enjoy
Release Notes
added an arrow indicator that shows when the rsi 7ma crosses over the rsi 1ma. Although this seems to slightly lag the cross i will be working to update the script to publish the arrows as soon as the cross happens when i get a little time to figure it out. EnjoyOpen-source script
In true TradingView spirit, the creator of this script has made it open-source, so that traders can review and verify its functionality. Kudos to the author! While you can use it for free, remember that republishing the code is subject to our House Rules.
Disclaimer
The information and publications are not meant to be, and do not constitute, financial, investment, trading, or other types of advice or recommendations supplied or endorsed by TradingView. Read more in the Terms of Use.
Open-source script
In true TradingView spirit, the creator of this script has made it open-source, so that traders can review and verify its functionality. Kudos to the author! While you can use it for free, remember that republishing the code is subject to our House Rules.
Disclaimer
The information and publications are not meant to be, and do not constitute, financial, investment, trading, or other types of advice or recommendations supplied or endorsed by TradingView. Read more in the Terms of Use.