OPEN-SOURCE SCRIPT
Candle Volatility Index [by NicoadW]
This is the migration of the CandleVolatilitIndex from MT4.
The indicator works as following:
Step 1: The "Volatility Value" is calculated by applying a moving average to the change of the selected source (default: 10-Period-SMA applied to the change from last close to this close -> SMA(close-close[1] , 10) )
Step 2: The signal line is calculated by applying a moving average onto the "Volatility Value" calculated in step 1.
The default settings are the same as in the original MT4 version.
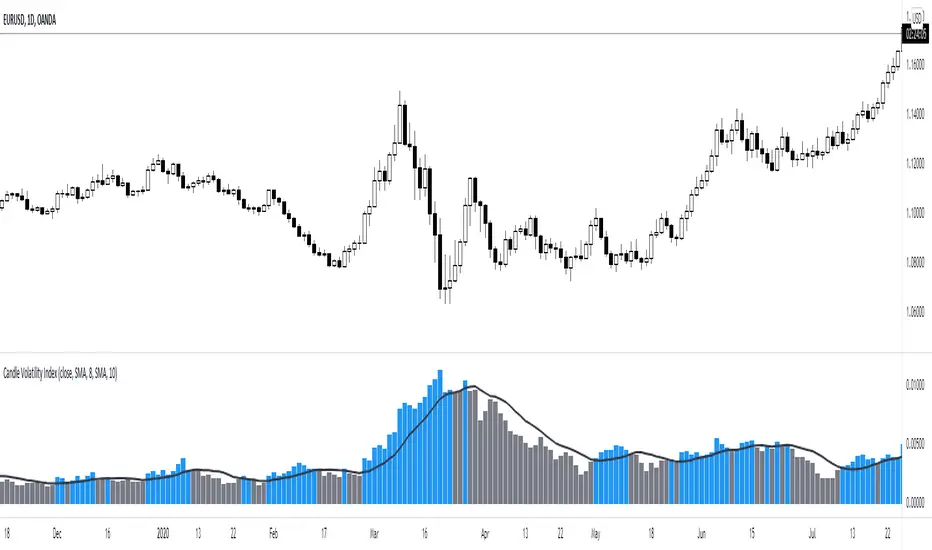
Visualization:
The histogram shows the "Volatility Value" calculated in step 1.
Case 1:
The value is above the signal line (blue bar) -> Volatility is given
Case 2:
The value is below the signal line (grey bar) -> Volatility is not there
This is intended to be used as a Volume/Volatility Indicator for a NNFX-System but can be used in any strategy.
The indicator works as following:
Step 1: The "Volatility Value" is calculated by applying a moving average to the change of the selected source (default: 10-Period-SMA applied to the change from last close to this close -> SMA(close-close[1] , 10) )
Step 2: The signal line is calculated by applying a moving average onto the "Volatility Value" calculated in step 1.
The default settings are the same as in the original MT4 version.
Visualization:
The histogram shows the "Volatility Value" calculated in step 1.
Case 1:
The value is above the signal line (blue bar) -> Volatility is given
Case 2:
The value is below the signal line (grey bar) -> Volatility is not there
This is intended to be used as a Volume/Volatility Indicator for a NNFX-System but can be used in any strategy.
Open-source script
In true TradingView spirit, the creator of this script has made it open-source, so that traders can review and verify its functionality. Kudos to the author! While you can use it for free, remember that republishing the code is subject to our House Rules.
Disclaimer
The information and publications are not meant to be, and do not constitute, financial, investment, trading, or other types of advice or recommendations supplied or endorsed by TradingView. Read more in the Terms of Use.