NSE: 2in1 Options-Index (Nifty-Bank-MID-Fin)
1. Using Two Charts in One Indicator with Buy and Sell Signals on Both Charts
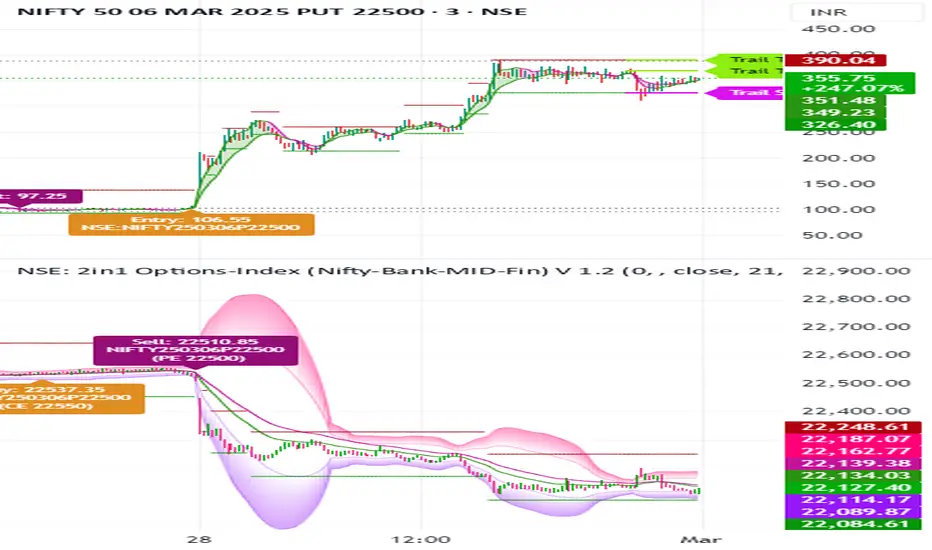
Dual-Chart Functionality: This indicator allows you to monitor two charts simultaneously – the main chart (Options) and the underlying index chart (NIFTY, BANKNIFTY, etc.).
The index chart (below the main chart) shows the underlying index movement.
The main chart displays the Options data (e.g., NIFTY options, BANKNIFTY options).
Buy/Sell Signals on Both Charts:
Buy and sell signals are generated on both the options chart and the index chart, ensuring you don’t miss any trading opportunities.
This dual-chart setup helps you correlate the movement of the index with the options data for better decision-making.
2. Works Across Major Indices (NIFTY, BANKNIFTY, FINNIFTY, etc.)
Automatic Index Detection: The script automatically detects the underlying index based on the chart symbol. It supports:
NIFTY, BANKNIFTY, FINNIFTY, MIDCPNIFTY, SENSEX
Flexibility: Whether you’re trading NIFTY options or BANKNIFTY options, the indicator adapts to the selected index and provides accurate signals.
3. Helps You Select ATM, ITM, and OTM Strikes (Ideal for Beginners and Advanced Traders)
ATM (At-The-Money) Strike Calculation:
The script calculates the ATM strike price based on the current spot price of the underlying index.
ITM (In-The-Money) and OTM (Out-Of-The-Money) Strikes:
Users can adjust the strike price using a slider to select ITM or OTM strikes.
This feature is especially helpful for beginners who are learning about options trading and want to understand the difference between ITM, ATM, and OTM strikes.
Strike Price Display:
The selected strike price is displayed on the chart, making it easy to identify the right strike for your trades.
4. Double EMA Selection for Trading
Customizable EMAs:
The script uses two Exponential Moving Averages (EMAs) to generate signals:
Short EMA (Default: 21 periods)
Long EMA (Default: 34 periods)
Users can customize the EMA lengths based on their trading strategy.
5. Option Chart in the Main Chart with Index Chart Below for Easy Monitoring
Integrated Chart Setup:
The main chart displays the options data (e.g., NIFTY options, BANKNIFTY options).
The index chart (below the main chart) shows the underlying index movement.
Benefits:
This setup allows you to monitor both the options and the index in a single view, making it easier to:
Correlate the movement of the index with the options data.
Identify trading opportunities directly on the chart.
No need to switch between multiple charts – everything is in one place.
6. Targets and Stop-Loss When the Signal is Generated
Dynamic Targets and Stop-Loss:
The script calculates targets and stop-loss levels based on the Predicted Range (PR) bands.
Trailing Stop-Loss:
The stop-loss level adjusts dynamically as the price moves in your favor.
Target Levels:
Two target levels are provided (Target 1 and Target 2) based on the PR bands.
Visual Indicators:
Targets and stop-loss levels are plotted on the chart with labels and lines for easy reference.
Colors:
Trailing Stop: Light Pink
Target 1: Light Green
Target 2: Light Green
7. Various Other Options in One Indicator
Advanced Statistical Bands (KRO Settings):
The script includes Kernel Regression Oscillator (KRO) settings for advanced traders.
Plots upper and lower bands based on standard deviation and kernel regression.
Helps identify overbought and oversold conditions.
Customizable Alerts:
Users can enable/disable alerts for:
Buy/Sell signals.
Trailing stop-loss hits.
Target achievements.
Summary of Benefits
All-in-One Tool: Combines candlestick analysis, EMAs, options strike selection, targets, stop-loss, and advanced statistical bands in a single indicator.
Beginner-Friendly: Helps new traders understand ATM, ITM, and OTM strikes while providing clear buy/sell signals.
Advanced Features: Includes KRO settings, dynamic targets, and trailing stop-loss for experienced traders.
Dual-Chart Setup: Monitor options and the underlying index simultaneously for better decision-making.
Customizable: Adjust EMA lengths, strike prices, colors, and alerts to suit your trading style.
Invite-only script
Only users approved by the author can access this script. You'll need to request and get permission to use it. This is typically granted after payment. For more details, follow the author's instructions below or contact SpartanTradingCo directly.
TradingView does NOT recommend paying for or using a script unless you fully trust its author and understand how it works. You may also find free, open-source alternatives in our community scripts.
Author's instructions
whatsapp 9071700888
t.me/+sMtK6vBqzZAwNGQ1
Disclaimer
Invite-only script
Only users approved by the author can access this script. You'll need to request and get permission to use it. This is typically granted after payment. For more details, follow the author's instructions below or contact SpartanTradingCo directly.
TradingView does NOT recommend paying for or using a script unless you fully trust its author and understand how it works. You may also find free, open-source alternatives in our community scripts.
Author's instructions
whatsapp 9071700888
t.me/+sMtK6vBqzZAwNGQ1