OPEN-SOURCE SCRIPT
Updated Scalping The Bull

Nome: Scalping The Bull (Indicatore)
Categoria: Scalping, Trend Following, Mean Reversion.
Timeframe: 1M, 5M, 30M, 1D, secondo la conformazione specifica.
(follow description in english)
Analisi tecnica: l’indicatore supporta le operatività descritte nei video di YouTube del canale “Scalping The Bull”. Di norma si basa su price action e medie mobili esponenziali.
Le varie tecniche che possono essere usate insieme all’indicatore sono sintetizzate nei settaggi dell’indicatore e si può fare riferimento ai video specifici per la spiegazione completa.
Utilizzo consigliato: Altcoin che presentano forti trend per scalping e operazioni intra-day.
Configurazione: È possibile configurare lo strumento in maniera semplice e completa.
Medie:
- Medie per mercato: e’ possibile utilizzare le medie mobili esponenziali (EMA) esclusivamente per il mercato Crypto (5/10/60/223).
- Media addizionale: e’ possibile visualizzare una media aggiuntiva, e.g. a 20 periodi.
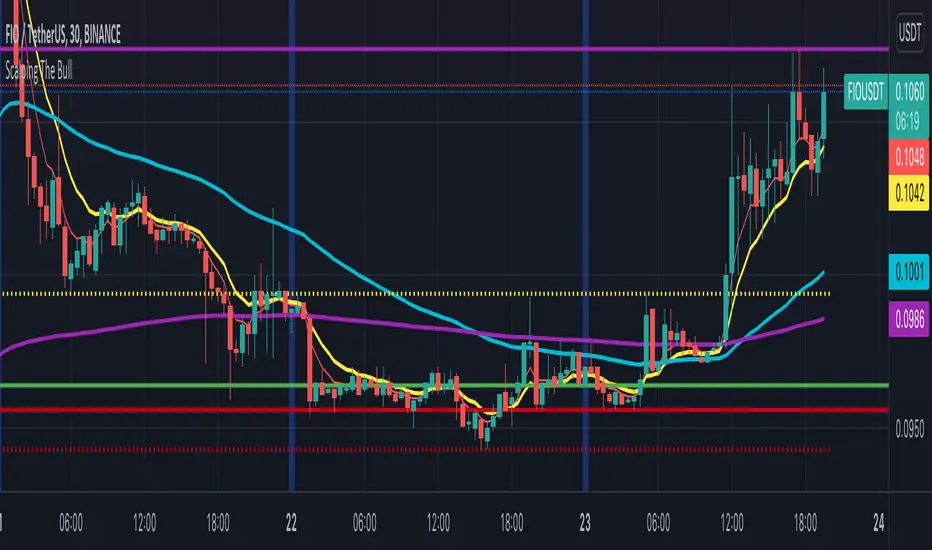
Elementi del grafico:Sfondo: segnala con lo sfondo del grafico in verde una situazione di uptrend ( EMA 60 > EMA 223) e in rosso sfondo rosso una situazione di downtrend (EMA 60 < EMA 223).
Separatori di sessioni: indica l’inizio della sessione corrente.
Punti Trigger:Massimi e minimi di oggi: disegna sul grafico il prezzo di apertura della candela daily e i massimi e i minimi di giornata.
Massimi minimi di ieri: disegna sul grafico il prezzo di apertura della candela daily, i massimi e i minimi del giorno prima.
(English description)
Name: Scalping The Bull (Indicator)
Category: Scalping, Trend Following, Mean Reversion.
Timeframe: 1M, 5M, 30M, 1D depending on the specific signal.
Technical Analysis: The indicator supports the operations described in the YouTube videos of the channel "Scalping The Bull". Usually it is based on price action and exponential moving averages.
The various techniques that can be used in conjunction with the indicator are summarized in the indicator settings and you can refer to the specific videos for the full explanation.
Suggested usage: Altcoin showing strong trends for scalping and intra-day trades.
Configuration:
Exponential Moving AveragesPer market: you can display averages exclusively for the Crypto market (5/10/60/223).
Additional Average: You can display an additional average, e.g. 20-period average.
Chart elements:Session Separators: indicates the beginning of the current session.
Background: signals with the background in green an uptrend situation ( 60 > 223) and in red background a downtrend situation (60 < 223).
Trigger points: - Today's highs and lows: draw on the chart the opening price of the daily candle and the highs and lows of the day.
- Yesterday's highs and lows: draw on the chart the opening price of the daily candle, the highs and lows of the previous day.
Release Notes
Graphics Improvements: SessionsOpen-source script
In true TradingView spirit, the creator of this script has made it open-source, so that traders can review and verify its functionality. Kudos to the author! While you can use it for free, remember that republishing the code is subject to our House Rules.
- Scalping The Bull Indicator: linktr.ee/scalpingthebull
- Scalping The Bull Training: tinyurl.com/corsoindicatorepro
- AlgoTrading Training: tiny.one/corsopinescriptbase
- Crypto News: t.me/joinchat/StkXJM
- Scalping The Bull Training: tinyurl.com/corsoindicatorepro
- AlgoTrading Training: tiny.one/corsopinescriptbase
- Crypto News: t.me/joinchat/StkXJM
Disclaimer
The information and publications are not meant to be, and do not constitute, financial, investment, trading, or other types of advice or recommendations supplied or endorsed by TradingView. Read more in the Terms of Use.
Open-source script
In true TradingView spirit, the creator of this script has made it open-source, so that traders can review and verify its functionality. Kudos to the author! While you can use it for free, remember that republishing the code is subject to our House Rules.
- Scalping The Bull Indicator: linktr.ee/scalpingthebull
- Scalping The Bull Training: tinyurl.com/corsoindicatorepro
- AlgoTrading Training: tiny.one/corsopinescriptbase
- Crypto News: t.me/joinchat/StkXJM
- Scalping The Bull Training: tinyurl.com/corsoindicatorepro
- AlgoTrading Training: tiny.one/corsopinescriptbase
- Crypto News: t.me/joinchat/StkXJM
Disclaimer
The information and publications are not meant to be, and do not constitute, financial, investment, trading, or other types of advice or recommendations supplied or endorsed by TradingView. Read more in the Terms of Use.