OPEN-SOURCE SCRIPT
ATR Bands
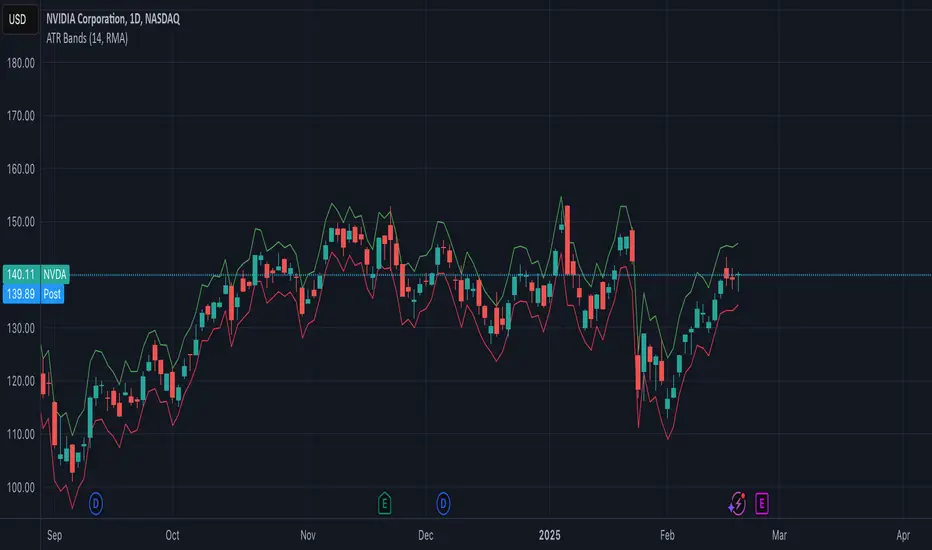
The ATR Bands indicator is a volatility-based tool that plots dynamic support and resistance levels around the price using the Average True Range (ATR). It consists of two bands:
Upper Band: Calculated as current price + ATR, representing an upper volatility threshold.
Lower Band: Calculated as current price - ATR, serving as a lower volatility threshold.
Key Features:
✅ Measures Volatility: Expands and contracts based on market volatility.
✅ Dynamic Support & Resistance: Helps identify potential breakout or reversal zones.
✅ Customizable Smoothing: Supports multiple moving average methods (RMA, SMA, EMA, WMA) for ATR calculation.
How to Use:
Trend Confirmation: If the price consistently touches or exceeds the upper band, it may indicate strong bullish momentum.
Reversal Signals: A price approaching the lower band may suggest a potential reversal or increased selling pressure.
Volatility Assessment: Wide bands indicate high volatility, while narrow bands suggest consolidation.
This indicator is useful for traders looking to incorporate volatility-based strategies into their trading decisions
Open-source script
In true TradingView spirit, the creator of this script has made it open-source, so that traders can review and verify its functionality. Kudos to the author! While you can use it for free, remember that republishing the code is subject to our House Rules.
Disclaimer
The information and publications are not meant to be, and do not constitute, financial, investment, trading, or other types of advice or recommendations supplied or endorsed by TradingView. Read more in the Terms of Use.