NulTa
IF it falls then get it on AKA IFGI
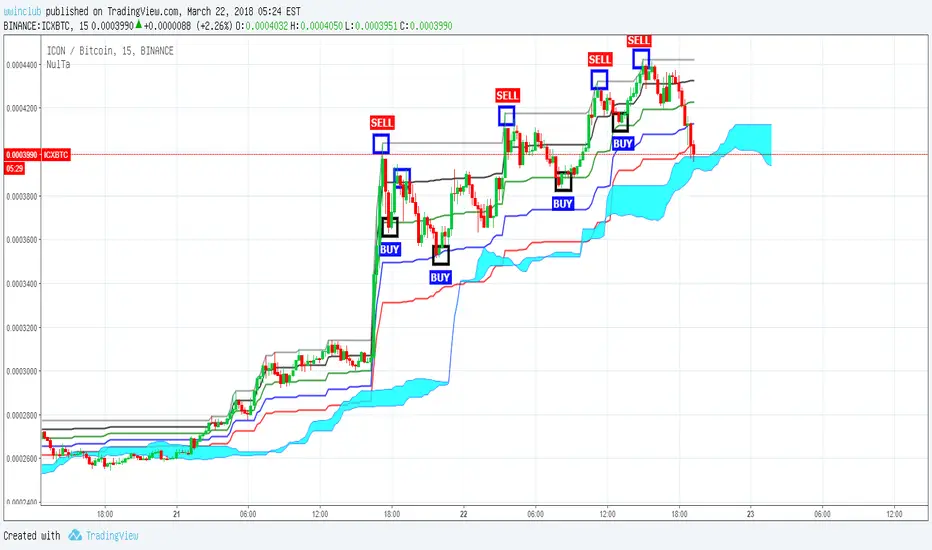
shares IFGI graph
The purpose of the indicator is to intuitively make it easy to see where the crush occurred and when the crush occurred (whilie "A rising section")
The method of trading using the indicator is to take the trading position from the support line below 2 spaces to the next resistance through the buyer
It is a very good indicator to "sell", and sometimes it has a good strength, or it may have 1 box on the section or 1 box rise
눌리면 타라
눌타지표 공유합니다
지표의 이용 목적은 상승추세에서 눌림 발생지역과 매도 발생시점을 직관적으로 보기 쉽게 도와주는 것 입니다
지표를 이용한 매매법은 구름대 위에서 고점대비 2칸 아래의 지지선에서 매수를 통해서 다음 저항까지의 간에 매매포지션을 가져 가는 것 입니다
매도에 매우 좋은 지표이고 간혹 힘이 좋거나 구간상 1칸 눌림 혹은 1칸 상승이 발생하기도 합니다
✅ Other indicators to help you trade
✅ 매매에 도움 되는 다른 지표

Basel major swing 1.0
Invite-only script
Only users authorized by the author have access to this script, and this usually requires payment. You can add the script to your favorites, but you will only be able to use it after requesting permission and obtaining it from its author — learn more here. For more details, follow the author's instructions below or contact ssabu directly.
TradingView does NOT recommend paying for or using a script unless you fully trust its author and understand how it works. You may also find free, open-source alternatives in our community scripts.
Author's instructions
Warning: please read our guide for invite-only scripts before requesting access.
cafe.naver.com/tradingviewmania
【 트레이딩 시스템 】
tradingviewmania-menu.oopy.io/
【 카톡 】
bit.ly/싸부_문의1
【 텔레그램 】
bit.ly/싸부텔레
Disclaimer
Invite-only script
Only users authorized by the author have access to this script, and this usually requires payment. You can add the script to your favorites, but you will only be able to use it after requesting permission and obtaining it from its author — learn more here. For more details, follow the author's instructions below or contact ssabu directly.
TradingView does NOT recommend paying for or using a script unless you fully trust its author and understand how it works. You may also find free, open-source alternatives in our community scripts.
Author's instructions
Warning: please read our guide for invite-only scripts before requesting access.
cafe.naver.com/tradingviewmania
【 트레이딩 시스템 】
tradingviewmania-menu.oopy.io/
【 카톡 】
bit.ly/싸부_문의1
【 텔레그램 】
bit.ly/싸부텔레