OPEN-SOURCE SCRIPT
Katik Cycle 56 Days
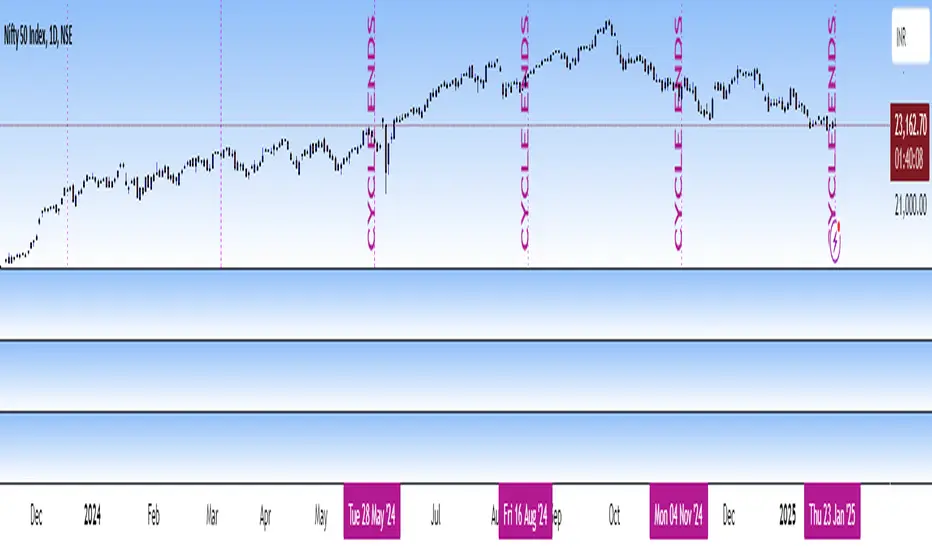
This script plots vertical dotted lines on the chart every 56 trading days, starting from the first bar. It calculates intervals based on the bar_index and draws the lines for both historical and future dates by projecting the lines forward.
The lines are extended across the entire chart height using extend=extend.both, ensuring visibility regardless of chart zoom level. You can customize the interval length using the input box.
Note: Use this only for 1D (Day) candle so that you can find the changes in the trend...
The lines are extended across the entire chart height using extend=extend.both, ensuring visibility regardless of chart zoom level. You can customize the interval length using the input box.
Note: Use this only for 1D (Day) candle so that you can find the changes in the trend...
Open-source script
In true TradingView spirit, the creator of this script has made it open-source, so that traders can review and verify its functionality. Kudos to the author! While you can use it for free, remember that republishing the code is subject to our House Rules.
Disclaimer
The information and publications are not meant to be, and do not constitute, financial, investment, trading, or other types of advice or recommendations supplied or endorsed by TradingView. Read more in the Terms of Use.