Yearly Levels for Day Traders
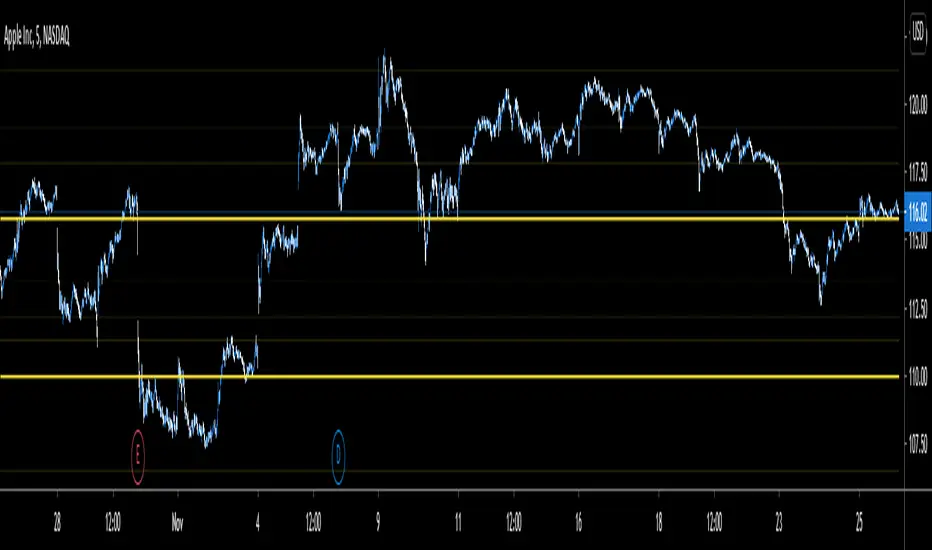
The script is useful in identifying price levels for the short term trading. The inputs are based on Fibonacci ratios but on yearly basis.
You will need to enter the pair ratio for where the stock is between ( I will show you).
Those pairs are as follows:
R1/R2
(0/0.23)
(.23/.38)
(.38/.61)
(.61/1)
(1/1.61)
(1.61/2.61)
(2.61/4.23)
(4.23/6.859)
(6.85/11.08)
(11.08/17.94)
(17.94/29.05)
(29.05/46.95)
(46.95/75.99)
(75.99/122.99)
I personally added the indicator multiple times to a template and put in all the pairs so I do not have to enter the pair each time.
The script does not tell you which level is a bottom or a top. Your experience matters.
If you are interested please PM me the username:
Invite-only script
Only users approved by the author can access this script. You'll need to request and get permission to use it. This is typically granted after payment. For more details, follow the author's instructions below or contact malrawi directly.
TradingView does NOT recommend paying for or using a script unless you fully trust its author and understand how it works. You may also find free, open-source alternatives in our community scripts.
Author's instructions
Disclaimer
Invite-only script
Only users approved by the author can access this script. You'll need to request and get permission to use it. This is typically granted after payment. For more details, follow the author's instructions below or contact malrawi directly.
TradingView does NOT recommend paying for or using a script unless you fully trust its author and understand how it works. You may also find free, open-source alternatives in our community scripts.