OPEN-SOURCE SCRIPT
RTH & ETH TWAPs [vnhilton]
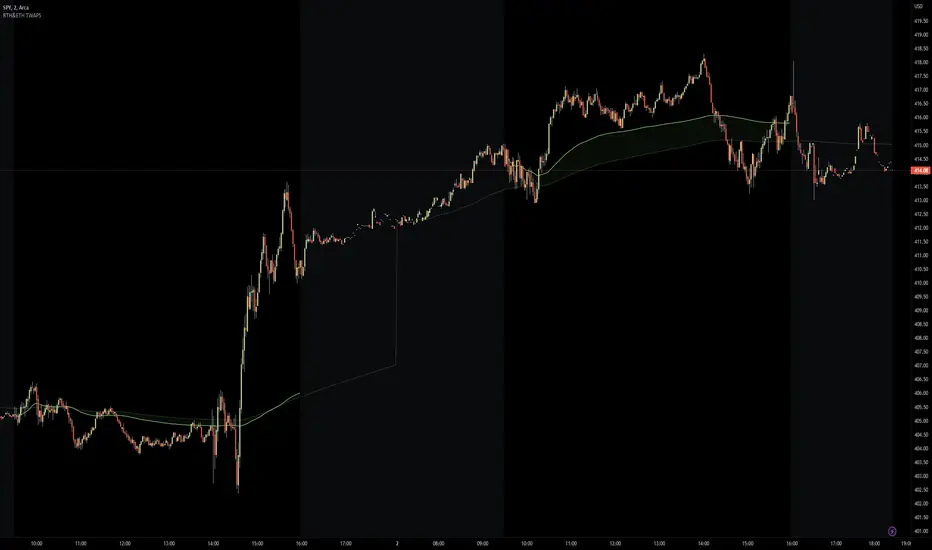
Plots 2 different TWAPs for regular & extended trading sessions, with option for a plot fill between the 2 (for the definition of TWAP, look at the Help Center for the built-in TWAP indicator by TradingView). More focus should be put on RTH TWAP as it's more likely to be used than ETH TWAP unless high volume was transacted during extended hours. We make a big assumption that there're traders willing to buy/sell when price breaks below/above day TWAP, in anticipation for move to the opposite side (usually people who put in TWAP orders don't use the day TWAP, rather the TWAP calculated when they submit the order).
Open-source script
In true TradingView spirit, the creator of this script has made it open-source, so that traders can review and verify its functionality. Kudos to the author! While you can use it for free, remember that republishing the code is subject to our House Rules.
Disclaimer
The information and publications are not meant to be, and do not constitute, financial, investment, trading, or other types of advice or recommendations supplied or endorsed by TradingView. Read more in the Terms of Use.