OPEN-SOURCE SCRIPT
Red Pill VWAP/RSI Divergence
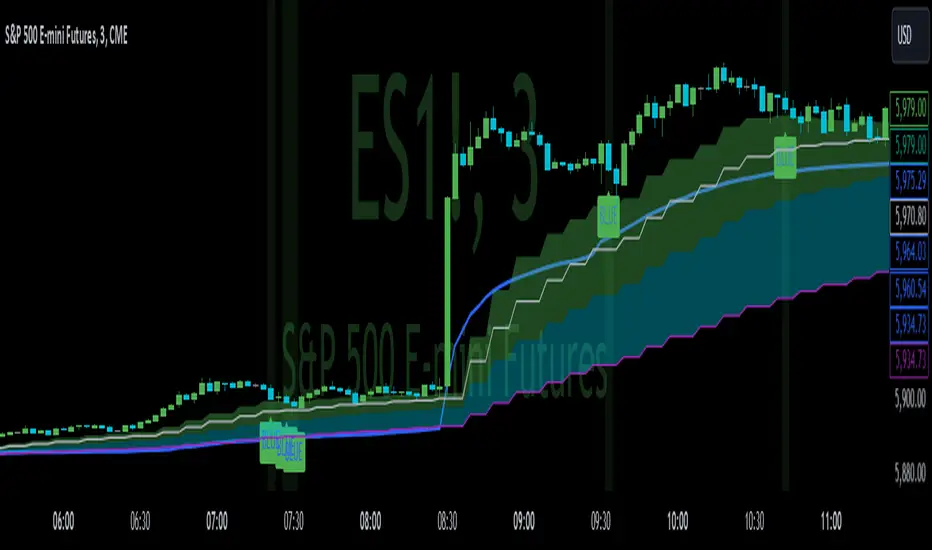
I created this indicator to identify moments in time VWAP and RSI are diverging.
Ideally useful in strong trend, bullish or bearish, as a potential entry point on a pull back for continuation. Not to be used as a stand alone signal, but rather in conjunction with any possible trend/momentum strategy.
VWAP is identified as the blue line. Green label(blue pill) is your potential entry on a pull back when price is above, stacked EMAS & VWAP for a long position. Red label(red pill) is your potential entry on a pull back when price is below inversely stacked EMAS & VWAP for a short position. These are the 2 ideal scenarios I have found. Please back test for yourself
I have had great results but must emphasis this is not a stand alone buy/sell. I use it in confluence to add conviction to my current A+ setups.
***Pivot ribbon in chart created by Saty Mahajan set to 3/10 time warp works ideal in conjunction.
***please note false positive and false negative signals can occur, particularly in chop
I hope you find this helpful . TRADE SAFE!
Open-source script
In true TradingView spirit, the creator of this script has made it open-source, so that traders can review and verify its functionality. Kudos to the author! While you can use it for free, remember that republishing the code is subject to our House Rules.
Disclaimer
The information and publications are not meant to be, and do not constitute, financial, investment, trading, or other types of advice or recommendations supplied or endorsed by TradingView. Read more in the Terms of Use.