OPEN-SOURCE SCRIPT
Finnie's HL BREAKOUT
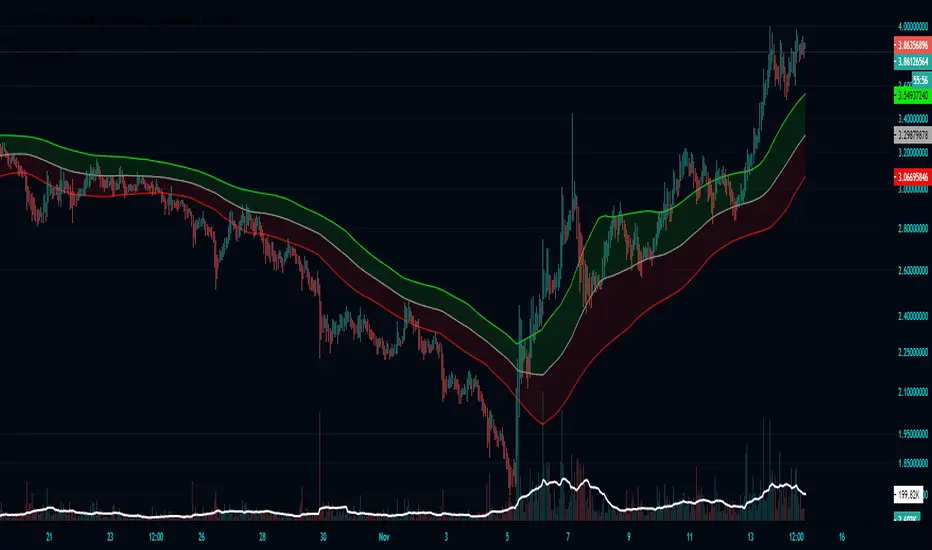
First the indicators takes a range, by default it is 22 candles, then finds the highest and lowest points of said range. At this point your left with lines that follow your support and resistance in the given range (take a look by change the 100 ema in settings to 1). To take things a step further I took a 100 candle ema of the highest highest and lowest lows to not only smooth things out, but also to provide visual ques for breakouts, when closing price is above the top band the asset is considered to be breaking out.
Open-source script
In true TradingView spirit, the creator of this script has made it open-source, so that traders can review and verify its functionality. Kudos to the author! While you can use it for free, remember that republishing the code is subject to our House Rules.
Disclaimer
The information and publications are not meant to be, and do not constitute, financial, investment, trading, or other types of advice or recommendations supplied or endorsed by TradingView. Read more in the Terms of Use.