OPEN-SOURCE SCRIPT
Abnormal Candle Detector

Abnormal Candle Detector
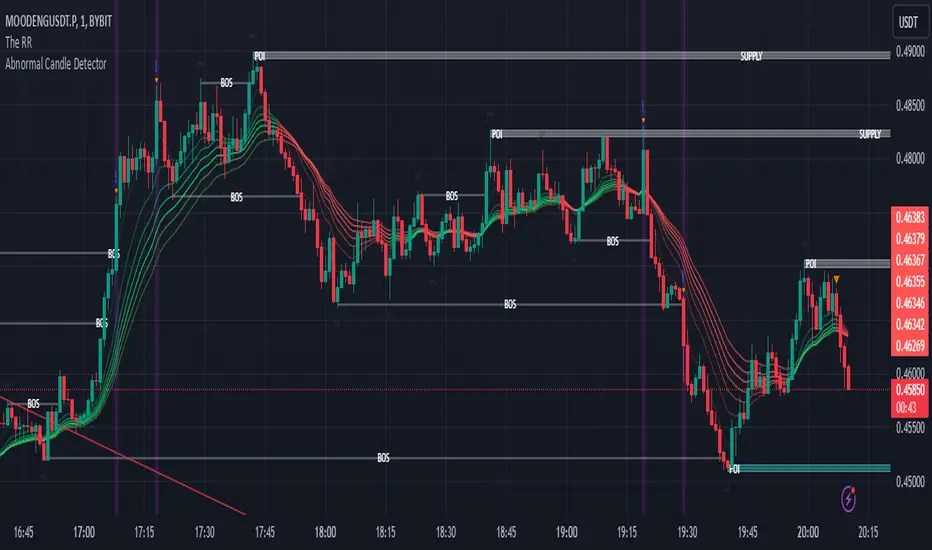
The Abnormal Candle Detector identifies sudden and unusual price movements by comparing the current candle's size and volume to recent averages. It highlights candles that deviate significantly from normal market behavior, helping traders spot breakouts, reversals, or high-impact events.
Features:
1. Abnormal Size Detection: Flags candles where the range (high-low) exceeds a user-defined multiplier of the average range.
2. Volume Confirmation: Optionally ensures abnormal movements are backed by higher-than-average volume.
3. Visual Markers:
Green triangles for bullish abnormal candles.
Red triangles for bearish abnormal candles.
Background highlights for better visibility.
4. Alerts: Real-time notifications when abnormal candles are detected.
Why Use It?
Spot early breakouts or trend reversals.
Identify high-impact events driven by news or institutional activity.
Filter noise and focus on significant market movements.
Customizable for any market or timeframe, the Abnormal Candle Detector is perfect for traders who want to stay ahead of major price action.
Open-source script
In true TradingView spirit, the creator of this script has made it open-source, so that traders can review and verify its functionality. Kudos to the author! While you can use it for free, remember that republishing the code is subject to our House Rules.
Disclaimer
The information and publications are not meant to be, and do not constitute, financial, investment, trading, or other types of advice or recommendations supplied or endorsed by TradingView. Read more in the Terms of Use.