OPEN-SOURCE SCRIPT
Updated Volume Divergence Polarity Grid [DW]

This study is an experiment built off the framework of my Dual Volume Divergence Index indicator.
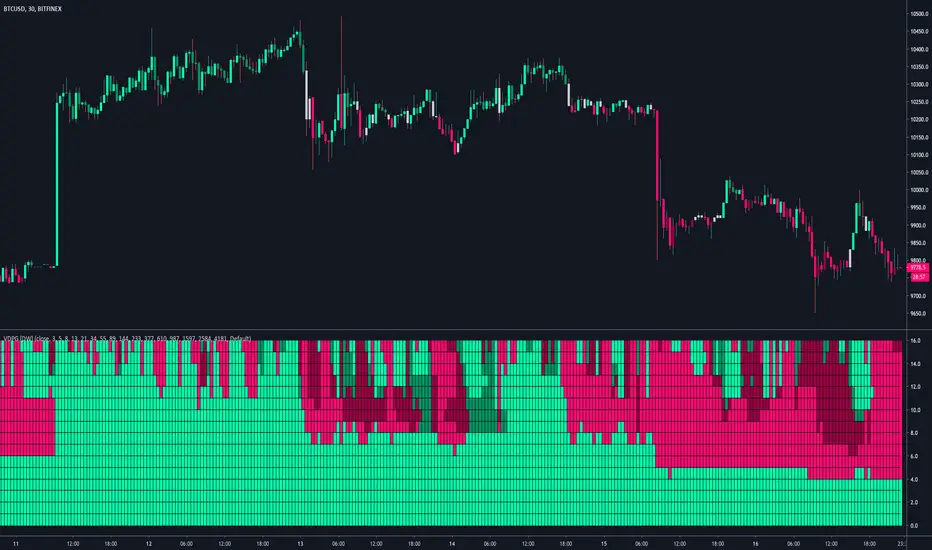
It is designed to gauge polarity over multiple lookback periods of your choice by expressing the data as a two color grid.
Positive Volume Divergence and Negative Volume Divergence are calculated, and their relative values are used to gauge polarity.
The order of the grid is top to bottom - the top is the first lookback period, and the bottom is the last.
Release Notes
Updates:-> Migrated to v4.
-> Condensed DVDI calculations into a singular function.
-> Corrected NaN values to stabilize initial conditions.
-> Added 7 more Polarity lines.
-> Reorganized script structure.
-> Eliminated fills. Indications are now expressed as columns.
-> Revamped color scheme.
Open-source script
In true TradingView spirit, the creator of this script has made it open-source, so that traders can review and verify its functionality. Kudos to the author! While you can use it for free, remember that republishing the code is subject to our House Rules.
For my full list of premium tools, check the blog:
wallanalytics.com/
Reach out on Telegram:
t.me/DonovanWall
wallanalytics.com/
Reach out on Telegram:
t.me/DonovanWall
Disclaimer
The information and publications are not meant to be, and do not constitute, financial, investment, trading, or other types of advice or recommendations supplied or endorsed by TradingView. Read more in the Terms of Use.