PROTECTED SOURCE SCRIPT
Updated RF Radio BTC MAs
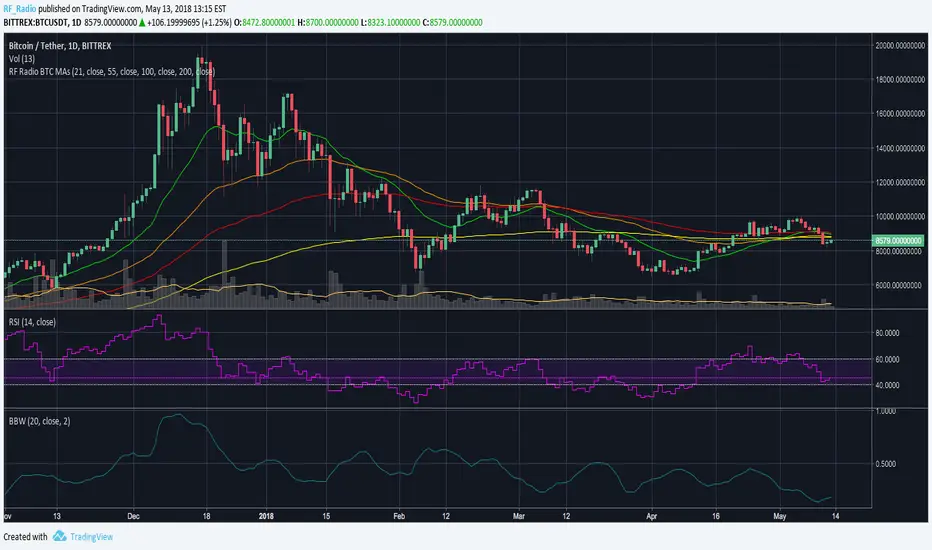
This script is intended to be used as a daily candle analysis of the BTC/USD price. It includes 3 EMAs, defaulted to the 21-day, 55-day, and 100-day EMAs respectively. It also includes the 200-day SMMA, a traditional indicator used to determine whether BTC is in a bear or bull market. Feel free to change the periods as you will, but at least now you have a simple solution for putting 4 moving averages on a chart at the same time with 1 indicator. Happy Trading!
-- RF Radio
-- RF Radio
Release Notes
I realized that my original indicator had the wrong designation for the 200-day moving average. I have since changed it to a simple moving average, as it was mistakenly set up as an exponential moving average. I apologize for any confusion this may have caused.Release Notes
And a cosmetic update, I forgot 1 little thing... Fixed now!Protected script
This script is published as closed-source. However, you can use it freely and without any limitations – learn more here.
Disclaimer
The information and publications are not meant to be, and do not constitute, financial, investment, trading, or other types of advice or recommendations supplied or endorsed by TradingView. Read more in the Terms of Use.
Protected script
This script is published as closed-source. However, you can use it freely and without any limitations – learn more here.
Disclaimer
The information and publications are not meant to be, and do not constitute, financial, investment, trading, or other types of advice or recommendations supplied or endorsed by TradingView. Read more in the Terms of Use.