Basma Tadawul KSA 2023
discovered by astronomical analysis
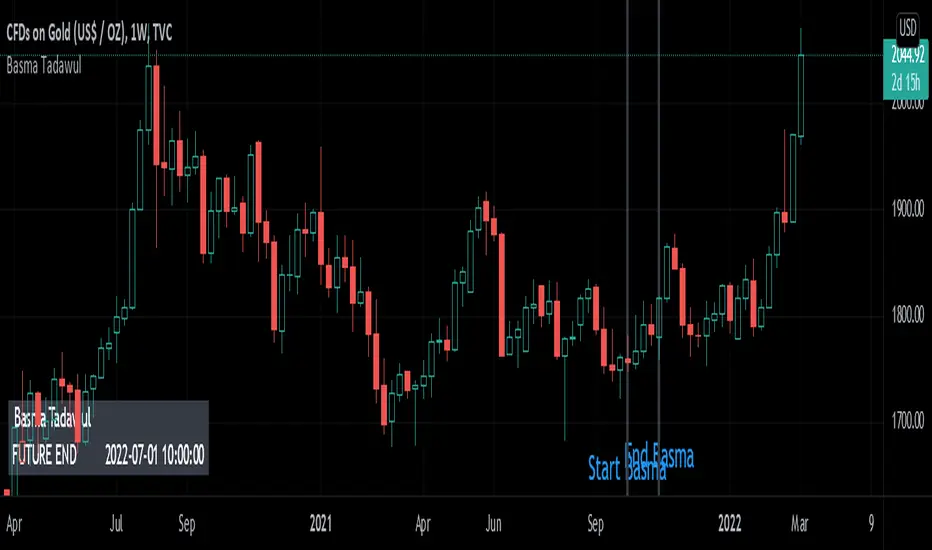
The indicator draws three columns that determine the beginning and end of the repetition of the movement forecast. We use the pattern clipping indicator to make a match between the current chart and the future forecast of the chart.
When the chart matches a specific percentage from the beginning of the pattern cut, it is confirmed that the imprint is real and we adopt the future forecast for the rest of the pattern
How to use Basma Tadawul System:
After placing the indicator on the chart, it will draw three virtical lines that show the beginning and end of the movement expected to be repeated
We use the tool to cut the pattern and draw it on the beginning and end of the forecast and then use it to predict the next price movement starting from the end of the previous movement
Invite-only script
Only users approved by the author can access this script. You'll need to request and get permission to use it. This is typically granted after payment. For more details, follow the author's instructions below or contact Basmatadawul directly.
TradingView does NOT recommend paying for or using a script unless you fully trust its author and understand how it works. You may also find free, open-source alternatives in our community scripts.
Author's instructions
Disclaimer
Invite-only script
Only users approved by the author can access this script. You'll need to request and get permission to use it. This is typically granted after payment. For more details, follow the author's instructions below or contact Basmatadawul directly.
TradingView does NOT recommend paying for or using a script unless you fully trust its author and understand how it works. You may also find free, open-source alternatives in our community scripts.