PROTECTED SOURCE SCRIPT
[KINGS TREND STRATEGY]
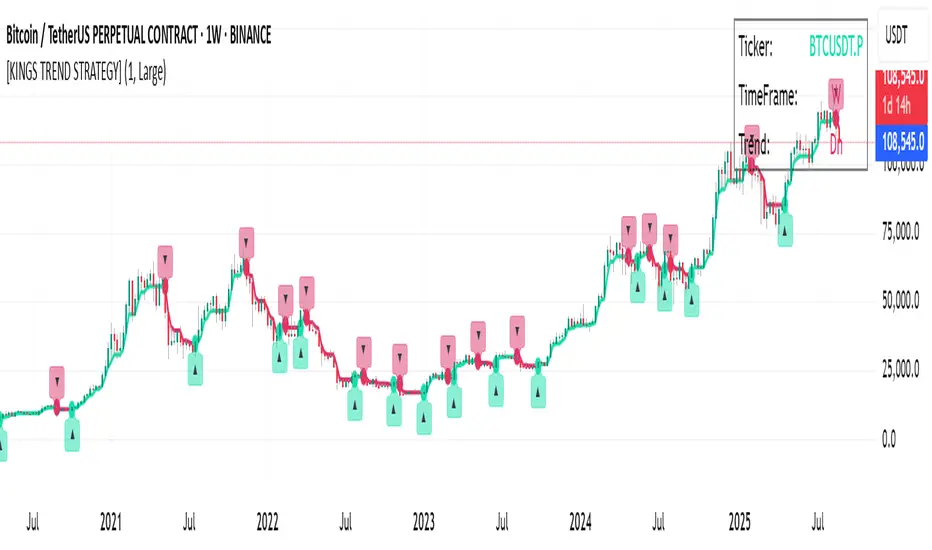
[KINGS TREND STRATEGY] – Kings Trend + Heikin Ashi Dynamic Tool
Category: Trend-Following / Swing Trading
Timeframes: Works on all timeframes (Intraday to Swing)
Markets: Stocks, Futures, Crypto, Forex
What is this Indicator?
[KINGS TREND STRATEGY] is a trend-following indicator that combines the Half Trend algorithm with optional Heikin Ashi smoothing.
It clearly shows the direction of the trend (Uptrend / Downtrend).
It highlights Buy and Sell signals at high-probability zones.
Optionally, you can color-code the candles based on trend direction.
Key Features
Half Trend Algorithm:
Removes price noise to clearly display the direction of the trend.
Amplitude (sensitivity) can be adjusted manually.
Heikin Ashi Mode (Optional):
Uses Heikin Ashi candles to smooth trend calculations.
Displays Trend Strength (%) to gauge how strong or weak the trend is.
Auto Buy / Sell Signals:
Up (▲) and Down (▼) arrows are plotted whenever a trend reversal occurs.
Signal colors:
#17DFAD (Aqua Green) → Uptrend Signal
#DD326B (Magenta Red) → Downtrend Signal
Dynamic Candle Coloring:
Candles can be colored automatically according to the trend.
In an uptrend, candles appear greenish; in a downtrend, reddish.
On-Chart Dashboard:
Ticker, Timeframe, and Trend Info are displayed live on the chart.
In Heikin Ashi mode, Trend Strength % is also shown.
How to Use
Add to Chart → Select Timeframe → Adjust “Amplitude”:
Low amplitude → more frequent signals (scalping).
High amplitude → fewer but more reliable signals (swing trading).
Watch Buy/Sell Arrows:
▲ Up Arrow: Indicates potential long entry (trend reversal up).
▼ Down Arrow: Indicates potential short entry (trend reversal down).
Optional Enhancements:
Enable trend candles for a cleaner chart view.
Enable Heikin Ashi mode for smoother signals.
Best Practices
Confirm signals using support/resistance levels, volume indicators, or momentum oscillators (RSI / MACD).
Higher timeframes (1H / 4H / 1D) tend to produce more reliable results.
Do not trade solely based on this indicator — risk management is essential.
Disclaimer
This indicator is for educational purposes only.
Past performance does not guarantee future results.
Always use stop-loss and proper risk control when trading.
Protected script
This script is published as closed-source. However, you can use it freely and without any limitations – learn more here.
Disclaimer
The information and publications are not meant to be, and do not constitute, financial, investment, trading, or other types of advice or recommendations supplied or endorsed by TradingView. Read more in the Terms of Use.