PROTECTED SOURCE SCRIPT
Updated VT SMA 50 DC with Fractals
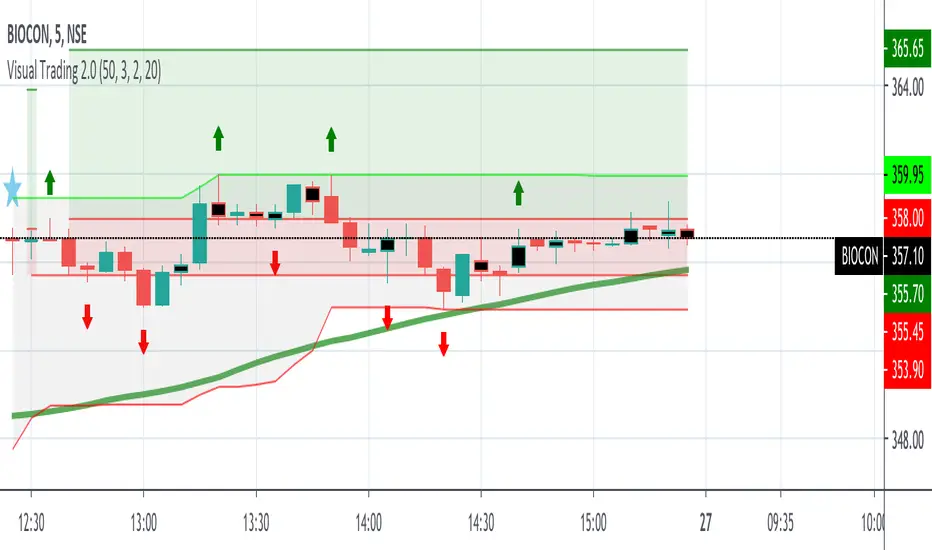
Buying or Selling levels are identified with SMA 50 along with Fractals for breakouts and reversals.
SMA will be green when the trend is Bullish
SMA will be red when the trend is Bearish
The color is set GREEN and RED for Bullish and Bearish trend
SMA will be green when the trend is Bullish
SMA will be red when the trend is Bearish
The color is set GREEN and RED for Bullish and Bearish trend
Release Notes
High Low range finderProtected script
This script is published as closed-source. However, you can use it freely and without any limitations – learn more here.
Disclaimer
The information and publications are not meant to be, and do not constitute, financial, investment, trading, or other types of advice or recommendations supplied or endorsed by TradingView. Read more in the Terms of Use.
Protected script
This script is published as closed-source. However, you can use it freely and without any limitations – learn more here.
Disclaimer
The information and publications are not meant to be, and do not constitute, financial, investment, trading, or other types of advice or recommendations supplied or endorsed by TradingView. Read more in the Terms of Use.