MTF BB%+ [Overlay] [Intromoto]
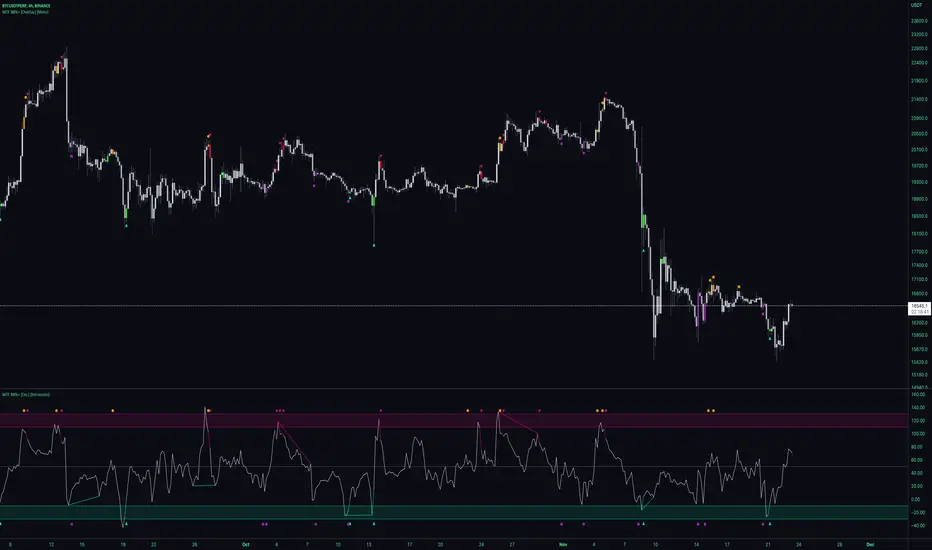
Plotshapes are printed when exiting extremes of the deviations, back towards the mean.
Arrows indicate an increased likelihood of price reverting direction. Red arrow =bearish, green arrow = bullish. Dots below candles = bullish, above candles = bearish.
Dots on the top and bottom of the candles show a sub level of reversion that would be perhaps less extreme than when price reenters the norm from the normal standard deviation.
Users can also change the timeframe of the indicator for high time frame signals.
Barcolors for plotshapes included.
DM for access
Thanks
Invite-only script
Only users approved by the author can access this script. You'll need to request and get permission to use it. This is typically granted after payment. For more details, follow the author's instructions below or contact Intromoto directly.
TradingView does NOT recommend paying for or using a script unless you fully trust its author and understand how it works. You may also find free, open-source alternatives in our community scripts.
Author's instructions
Warning: please read our guide for invite-only scripts before requesting access.
Follow on Twitter for updates.
One time fee, no subscription
twitter.com/IntroMoto
Disclaimer
Invite-only script
Only users approved by the author can access this script. You'll need to request and get permission to use it. This is typically granted after payment. For more details, follow the author's instructions below or contact Intromoto directly.
TradingView does NOT recommend paying for or using a script unless you fully trust its author and understand how it works. You may also find free, open-source alternatives in our community scripts.
Author's instructions
Warning: please read our guide for invite-only scripts before requesting access.
Follow on Twitter for updates.
One time fee, no subscription
twitter.com/IntroMoto