OPEN-SOURCE SCRIPT
Higher Timeframe Separator
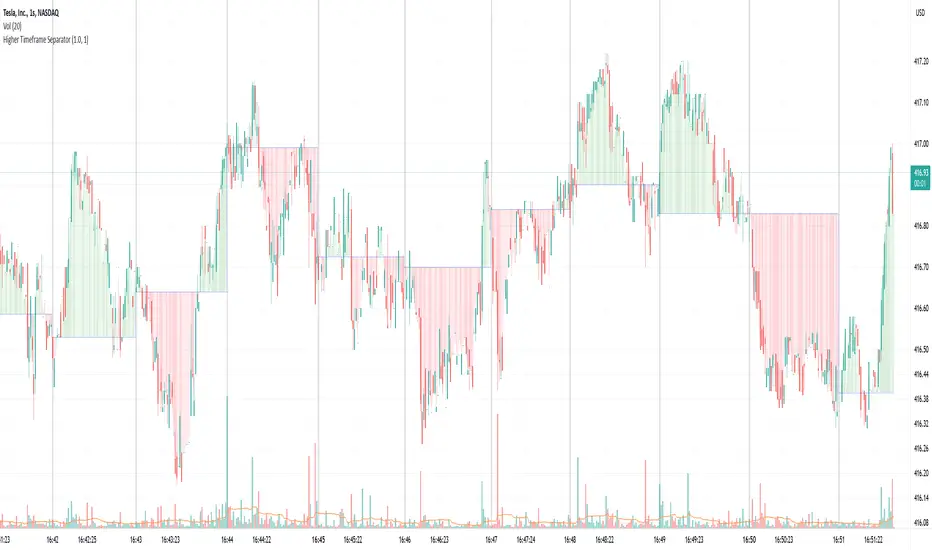
This script helps visually identify when a higher timeframe candle starts by drawing a vertical line. It also shades the area above or below the opening price, making it easier to track price movement relative to the higher timeframe.
Why It's Useful
If you use multiple timeframes, this indicator provides a clear visual reference for where the price is relative to the higher timeframe. This is much more convenient than constantly switching between charts. You can see in the screenshot below how much clearer the price action becomes when the indicator is enabled:

Additional Benefit
If you trade on a lower timeframe and notice that the number of bars between separators is inconsistent, it means there weren’t enough trades during that period—indicating low liquidity. Illiquid instruments can be riskier to trade. For example, observe how the vertical lines on the left side of the image below are densely packed:

Why It's Useful
If you use multiple timeframes, this indicator provides a clear visual reference for where the price is relative to the higher timeframe. This is much more convenient than constantly switching between charts. You can see in the screenshot below how much clearer the price action becomes when the indicator is enabled:
Additional Benefit
If you trade on a lower timeframe and notice that the number of bars between separators is inconsistent, it means there weren’t enough trades during that period—indicating low liquidity. Illiquid instruments can be riskier to trade. For example, observe how the vertical lines on the left side of the image below are densely packed:
Open-source script
In true TradingView spirit, the creator of this script has made it open-source, so that traders can review and verify its functionality. Kudos to the author! While you can use it for free, remember that republishing the code is subject to our House Rules.
Disclaimer
The information and publications are not meant to be, and do not constitute, financial, investment, trading, or other types of advice or recommendations supplied or endorsed by TradingView. Read more in the Terms of Use.