PROTECTED SOURCE SCRIPT
Pips Volatility Comparison

Japanese below / 日本語説明は下記
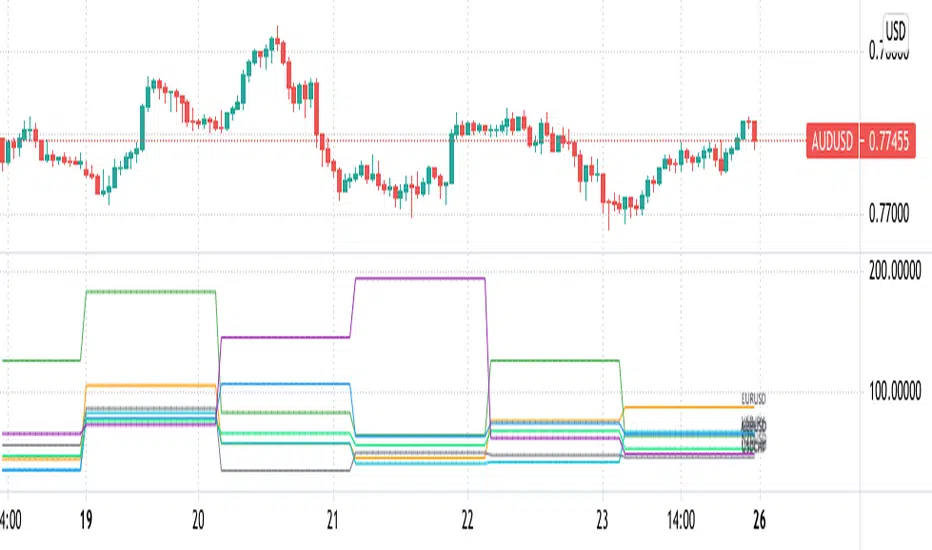
This indicator shows daily volatility in pips for multiple currency pairs so as to compare and identify most volatile pairs of the day.
Some traders would prefer to change pairs to trade depending on volatility while some traders would refrain from trading if overall market volatility is less or their favorite pairs are less volatile compared to previous days. That’s when this indicator would help.
Currency pairs can be selected from 25 pairs from US dollar cross, Yen cross, Euro cross, GBP cross and AUD cross. You can select what to display depending on your needs.
Pips volatility is calculated using high and low of the day and being updated as high/low updated.
Example :
The following chart shows EURUSD moved around 80 pips on Apr23, 2021 and is the most volatile pairs of the day among major US dollar crosses.

----------------------
複数通貨ペアのボラティリティをPipsで比較することのできるインジケーターです。
トレーダーの中にはボラティリティによって日毎にトレードする通貨ペアを変えたり、マーケット全体のボラティリティが低下していればトレードを控えたりする方もいると思います。また、お気に入りの通貨ペアのボラティリティが過去数日と比べて低い場合はトレードしないという判断もありうるでしょう。そういった判断に役立つかもしれません。
通貨ペアはドルストレート、クロス円、ユーロクロス、ポンドクロス、豪ドルクロスの25通貨ペアから必要なものを複数選択することが可能です。
Pipsは当日の高値・安値を使って計算し、日中の変動に合わせて随時更新されます。
例:
以下のチャートではEURUSDが2021年4月23日に約80pipsの変動があったことを示しています。
これは他の主要ドルストレートペアと比べ最も大きい値動きであることがわかります。

This indicator shows daily volatility in pips for multiple currency pairs so as to compare and identify most volatile pairs of the day.
Some traders would prefer to change pairs to trade depending on volatility while some traders would refrain from trading if overall market volatility is less or their favorite pairs are less volatile compared to previous days. That’s when this indicator would help.
Currency pairs can be selected from 25 pairs from US dollar cross, Yen cross, Euro cross, GBP cross and AUD cross. You can select what to display depending on your needs.
Pips volatility is calculated using high and low of the day and being updated as high/low updated.
Example :
The following chart shows EURUSD moved around 80 pips on Apr23, 2021 and is the most volatile pairs of the day among major US dollar crosses.
----------------------
複数通貨ペアのボラティリティをPipsで比較することのできるインジケーターです。
トレーダーの中にはボラティリティによって日毎にトレードする通貨ペアを変えたり、マーケット全体のボラティリティが低下していればトレードを控えたりする方もいると思います。また、お気に入りの通貨ペアのボラティリティが過去数日と比べて低い場合はトレードしないという判断もありうるでしょう。そういった判断に役立つかもしれません。
通貨ペアはドルストレート、クロス円、ユーロクロス、ポンドクロス、豪ドルクロスの25通貨ペアから必要なものを複数選択することが可能です。
Pipsは当日の高値・安値を使って計算し、日中の変動に合わせて随時更新されます。
例:
以下のチャートではEURUSDが2021年4月23日に約80pipsの変動があったことを示しています。
これは他の主要ドルストレートペアと比べ最も大きい値動きであることがわかります。
Protected script
This script is published as closed-source. However, you can use it freely and without any limitations – learn more here.
■”なぜ”がわかる相場分析
・チャートの動きというファクトを元に
・客観的かつロジカルに
・初心者でもわかるように
相場展望を解説
Followすると投稿の度に通知が届きます。
bit.ly/3s888QI
■Editor's Pick
bit.ly/3pkLCEl
■Blog
bit.ly/2VPAMJk
■Indicator
bit.ly/3lmWYFk
■Membership
bit.ly/3zvLkPG
・チャートの動きというファクトを元に
・客観的かつロジカルに
・初心者でもわかるように
相場展望を解説
Followすると投稿の度に通知が届きます。
bit.ly/3s888QI
■Editor's Pick
bit.ly/3pkLCEl
■Blog
bit.ly/2VPAMJk
■Indicator
bit.ly/3lmWYFk
■Membership
bit.ly/3zvLkPG
Disclaimer
The information and publications are not meant to be, and do not constitute, financial, investment, trading, or other types of advice or recommendations supplied or endorsed by TradingView. Read more in the Terms of Use.