OPEN-SOURCE SCRIPT
SMA200 & RSI [Tarun]
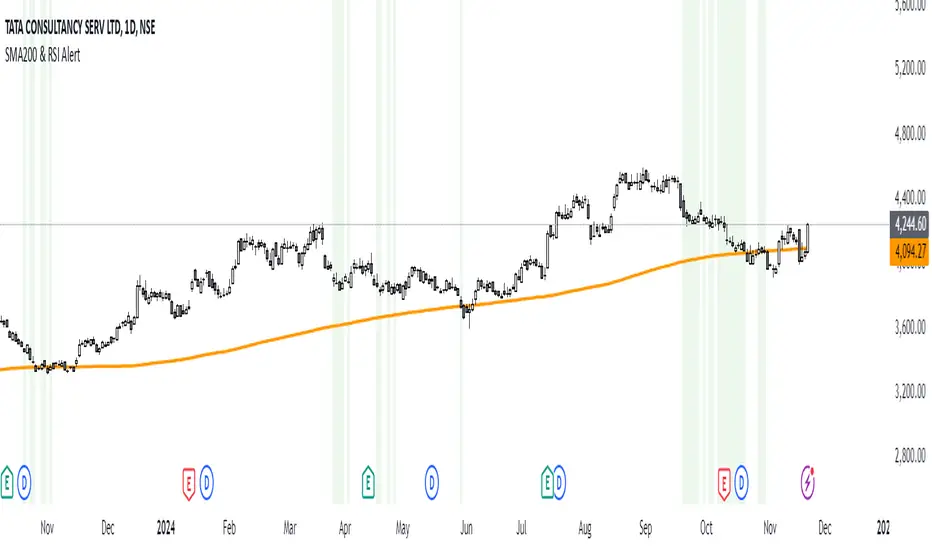
The SMA200 & RSI Signal Indicator is a powerful tool designed for traders who want to identify potential entry zones based on a combination of price action and momentum. This indicator combines two essential trading components:
How It Works:
When both conditions are met, the indicator triggers:
Disclaimer:
- SMA200 (Simple Moving Average): A widely used trend-following tool that highlights the overall direction of the market.
- RSI (Relative Strength Index): A momentum oscillator that measures the speed and change of price movements.
How It Works:
- Price Above SMA200: Indicates bullish market conditions.
- RSI Between 40 and 20: Suggests that the asset is in a potential oversold or pullback zone within a bullish trend.
When both conditions are met, the indicator triggers:
- Background Highlight: The chart background turns green to indicate a potential signal zone.
Disclaimer:
This indicator is not a standalone trading strategy. Use it in conjunction with other analysis methods such as support and resistance, candlestick patterns, or volume analysis. Always practice proper risk management.
Open-source script
In true TradingView spirit, the creator of this script has made it open-source, so that traders can review and verify its functionality. Kudos to the author! While you can use it for free, remember that republishing the code is subject to our House Rules.
Disclaimer
The information and publications are not meant to be, and do not constitute, financial, investment, trading, or other types of advice or recommendations supplied or endorsed by TradingView. Read more in the Terms of Use.