OPEN-SOURCE SCRIPT
Updated Statistics Table

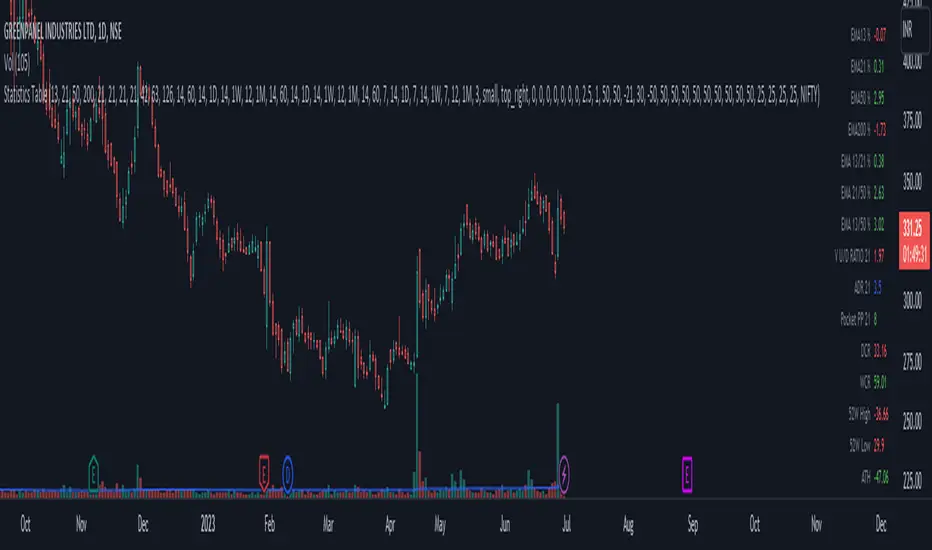
This script display some useful Statistics data that can be useful in making trading decision.
Here the list of information this script is display in table format.
You can change each and every single ema and rs length as per your need from setting.
1) close difference from first ema
2) close difference from second ema
3) close difference from third ema
4) close difference from fourth ema
5) difference between first and second ema
6) difference between second and third ema
7) difference between first and third ema
8) volume up down ratio
9) ATR/ADR %
10) volume pocket pivot count
11) daily closing range
12) weekly closing range
13) close difference from 52week high
14) close difference from 52week low
15) close difference from All time high
16) close difference from All time low
17) rs line above or below first rs ema
18) rs line above or below second rs ema
19) rs line above or below third rs ema
20) rs line above or below fourth rs ema
21) first rs value
22) second rs value
23) third rs value
24) fourth rs value
25) difference between previous first rs length days change % and current first rs length days change %
26) difference between previous second rs length days change % and current second rs length days change %
27) difference between previous third rs length days change % and current third rs length days change %
Release Notes
Added option to hide show each single optionRelease Notes
Added options to changecolor of regular value
color of positive value
color of negative value
color of label text
change the font size of whole table
Release Notes
bug fix in negative value color option.Release Notes
Added option to setup positive checking condition value as per your need.All the value is checking with greater than equal to.
-> Positive First EMA Diff
-> Positive Second EMA Diff
-> Positive Third EMA Diff
-> Positive Fourth EMA Diff
-> Positive First - Second EMA Diff
-> Positive Second - Third EMA Diff
-> Positive First - Third EMA Diff
-> Positive V U/D RATIO
-> Positive Pocket Pivot Point
-> Positive Daily Closing Range
-> Positive Weekly Closing Range
-> Positive From 52 Week High
-> Positive From 52 Week Low
-> Positive From All Time High
-> Positive From All Time Low
Release Notes
Added option to change the table positionRelease Notes
Corrected negative value color label textRelease Notes
Added 4 RSI with its own timeframe.Release Notes
Added 4 CCI with each different timeframeBug fix in RSI code.
Release Notes
Bug fix in 52 Week high/low code.Release Notes
Added Directional movement index ADX and some improvements
Release Notes
Bug fix in code.Open-source script
In true TradingView spirit, the creator of this script has made it open-source, so that traders can review and verify its functionality. Kudos to the author! While you can use it for free, remember that republishing the code is subject to our House Rules.
Disclaimer
The information and publications are not meant to be, and do not constitute, financial, investment, trading, or other types of advice or recommendations supplied or endorsed by TradingView. Read more in the Terms of Use.
Open-source script
In true TradingView spirit, the creator of this script has made it open-source, so that traders can review and verify its functionality. Kudos to the author! While you can use it for free, remember that republishing the code is subject to our House Rules.
Disclaimer
The information and publications are not meant to be, and do not constitute, financial, investment, trading, or other types of advice or recommendations supplied or endorsed by TradingView. Read more in the Terms of Use.