OPEN-SOURCE SCRIPT
Fresh Zones
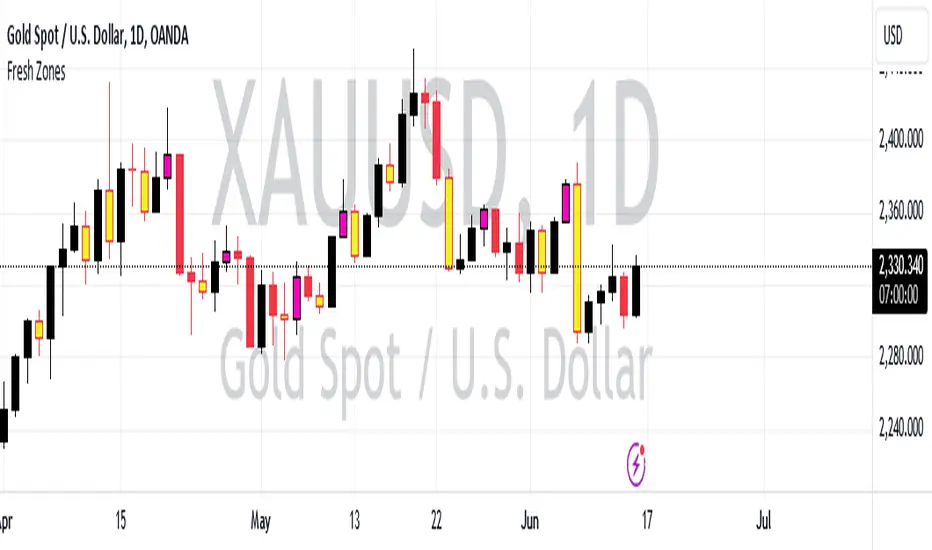
The indicator is named "Fresh Zones"
Bullish Fresh Zone:
- This part looks for a specific pattern in the price movement that indicates a potential bullish (upward) trend.
- It checks if the current bar's low price is higher than the previous bar's opening price.
- It also checks if the previous bar's closing price was higher than its opening price.
- Additionally, it checks if the bar before the previous one had a closing price lower than its opening price.
- If all these conditions are met, it identifies a bullish fresh zone.
Bearish Fresh Zone:
- This part looks for a specific pattern in the price movement that indicates a potential bearish (downward) trend.
- It checks if the current bar's high price is lower than the previous bar's opening price.
- It also checks if the previous bar's closing price was lower than its opening price.
- Additionally, it checks if the bar before the previous one had a closing price higher than its opening price.
- If all these conditions are met, it identifies a bearish fresh zone.
Color Coding:
- When a bullish fresh zone is identified, it colors the candlestick from two bars ago with a specific yellowish color (`color.rgb(240, 243, 33)`).
- When a bearish fresh zone is identified, it colors the candlestick from two bars ago with a specific pink color (`color.rgb(255, 0, 191)`).
Alert:
- The script creates an alert condition.
- If either a bullish or bearish fresh zone pattern appears, it triggers an alert with the message "A Fresh zone has appeared!".
Open-source script
In true TradingView spirit, the creator of this script has made it open-source, so that traders can review and verify its functionality. Kudos to the author! While you can use it for free, remember that republishing the code is subject to our House Rules.
Disclaimer
The information and publications are not meant to be, and do not constitute, financial, investment, trading, or other types of advice or recommendations supplied or endorsed by TradingView. Read more in the Terms of Use.