OPEN-SOURCE SCRIPT
Updated VVIX/VIX Ratio with Interpretation Levels
VVIX/VIX Ratio with Interpretation Levels
This indicator plots the ratio of VVIX (Volatility of Volatility Index) to VIX (CBOE Volatility Index) in a separate panel.
The ratio highlights when the options market is pricing unusually high volatility in volatility (VVIX) relative to the base volatility index (VIX).
Ratio < 5 → Complacency: Markets expect stability; often a pre-shock zone.
5–6 → Tension Building: Traders begin hedging volatility risk while VIX remains low.
6–7 → Elevated Risk: Divergence warns of potential regime change in volatility.
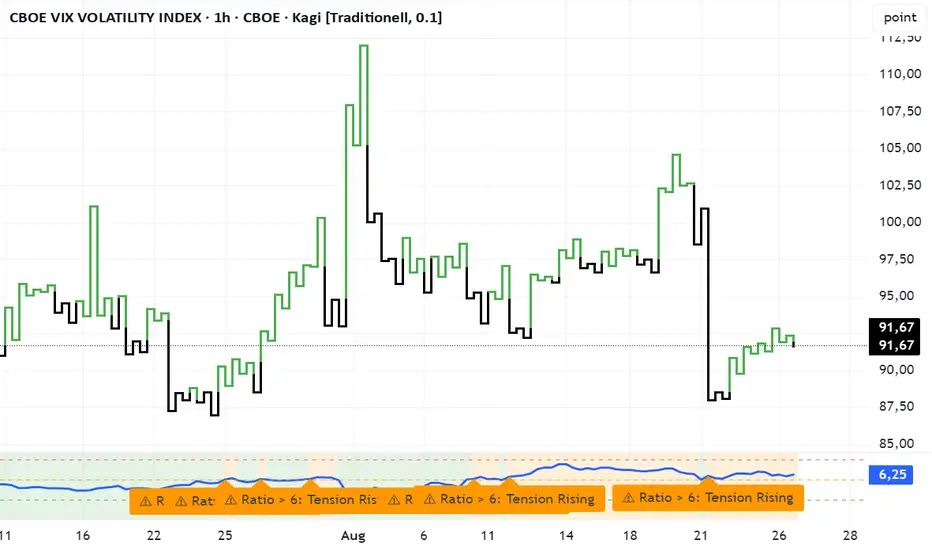
> 7 → High-Risk Zone: Options market pricing aggressive swings; can precede volatility spikes in equities.
The script also includes dashed interpretation lines (5, 6, 7) and automatic labels when key thresholds are crossed.
Background shading helps visualize current regime.
Use cases:
Detect hidden stress when VIX remains calm but VVIX rises.
Anticipate potential volatility regime shifts.
Support risk management and timing of long/short volatility strategies.
This indicator plots the ratio of VVIX (Volatility of Volatility Index) to VIX (CBOE Volatility Index) in a separate panel.
The ratio highlights when the options market is pricing unusually high volatility in volatility (VVIX) relative to the base volatility index (VIX).
Ratio < 5 → Complacency: Markets expect stability; often a pre-shock zone.
5–6 → Tension Building: Traders begin hedging volatility risk while VIX remains low.
6–7 → Elevated Risk: Divergence warns of potential regime change in volatility.
> 7 → High-Risk Zone: Options market pricing aggressive swings; can precede volatility spikes in equities.
The script also includes dashed interpretation lines (5, 6, 7) and automatic labels when key thresholds are crossed.
Background shading helps visualize current regime.
Use cases:
Detect hidden stress when VIX remains calm but VVIX rises.
Anticipate potential volatility regime shifts.
Support risk management and timing of long/short volatility strategies.
Release Notes
DescriptionThe VVIX/VIX Ratio Indicator plots the ratio of the CBOE VVIX (Volatility of Volatility Index) to the CBOE VIX (Volatility Index) in a separate panel.
This ratio is a useful signal to detect when the options market is pricing volatility-of-volatility significantly higher relative to equity volatility.
Interpretation Levels
Ratio < 5 → Complacency – Market calm, often precedes shocks
5–6 → Tension Building – Options traders begin hedging, VIX still calm
6–7 → Elevated Risk – Divergence may indicate regime shift
> 7 → High-Risk Zone – Panic or crisis pricing, potential volatility spike
Features:
Colored background zones (complacency → high risk)
Horizontal threshold lines at 5, 6, 7
Automatic labels when levels are crossed
Clean ratio visualization with customizable levels
Use Cases:
Early warning system for hidden stress when VIX remains low
Risk management for volatility strategies
Identifying regime changes in volatility pricing
License
Open Source – MIT License (2025).
Free to use, share, and modify with attribution.
Disclaimer: This script is for educational purposes only and does not constitute financial advice. Use at your own risk.
Open-source script
In true TradingView spirit, the creator of this script has made it open-source, so that traders can review and verify its functionality. Kudos to the author! While you can use it for free, remember that republishing the code is subject to our House Rules.
Disclaimer
The information and publications are not meant to be, and do not constitute, financial, investment, trading, or other types of advice or recommendations supplied or endorsed by TradingView. Read more in the Terms of Use.