OPEN-SOURCE SCRIPT
20 Camarilla Pivot Points
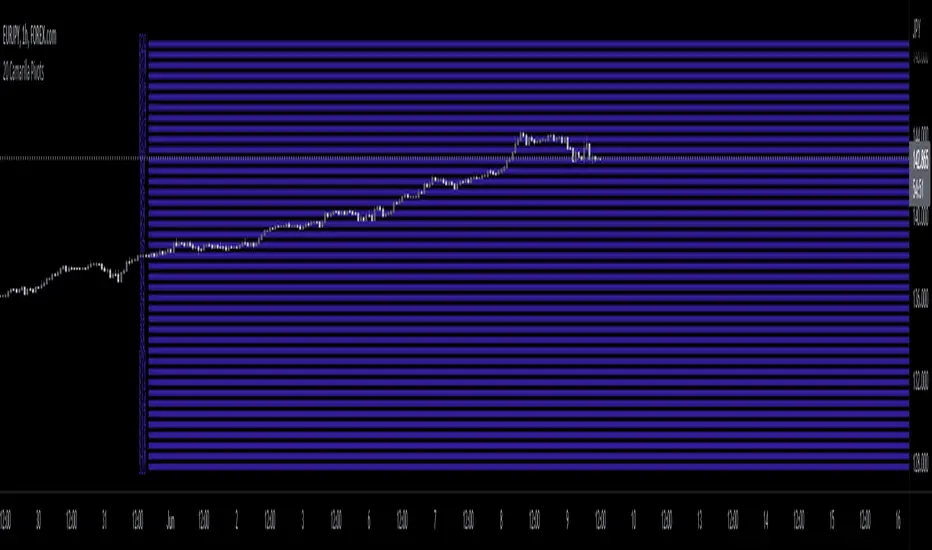
This indicator plots 20 Camarilla pivot points above and below the pivot based on the selected time frame. This is useful when price goes between the standard 3 and 4 pivots and above 4. Note that the normal 4 pivot point is labeled as 6 in this indicator. You can change the color of each set of pivots so you can mark the standard Camarilla pivots if you wish. The image is using monthly Camarilla pivots on a 1 hour time frame.
Open-source script
In true TradingView spirit, the creator of this script has made it open-source, so that traders can review and verify its functionality. Kudos to the author! While you can use it for free, remember that republishing the code is subject to our House Rules.
Disclaimer
The information and publications are not meant to be, and do not constitute, financial, investment, trading, or other types of advice or recommendations supplied or endorsed by TradingView. Read more in the Terms of Use.