PROTECTED SOURCE SCRIPT
SPX Bull Market, Bear market and Corrections Since 1929
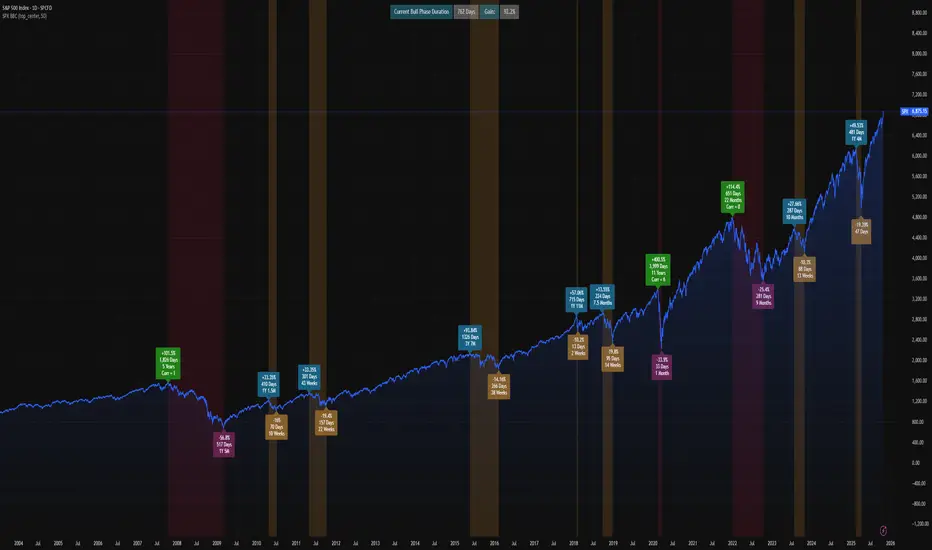
This script show visually with labels all the BULL & BEAR Market since 1929 with intermediary corrections.
Bear Market = Price drop of >=20% (based on closing price not intra day low)
Corrections = Price drop of >=10% and < 20% (based on closing price not intra day low, in intraday price it may go beyond 20% but closes in less than 20% )
The script doesn't update as we move forward , I need to manually update during every correction/bull/bear phases.
It is a good visual to study the past bull and bear market to gain some key insights!
Protected script
This script is published as closed-source. However, you can use it freely and without any limitations – learn more here.
Disclaimer
The information and publications are not meant to be, and do not constitute, financial, investment, trading, or other types of advice or recommendations supplied or endorsed by TradingView. Read more in the Terms of Use.